Understand the tools
An index is a list with rules.
An ETF turns it into something you can own.
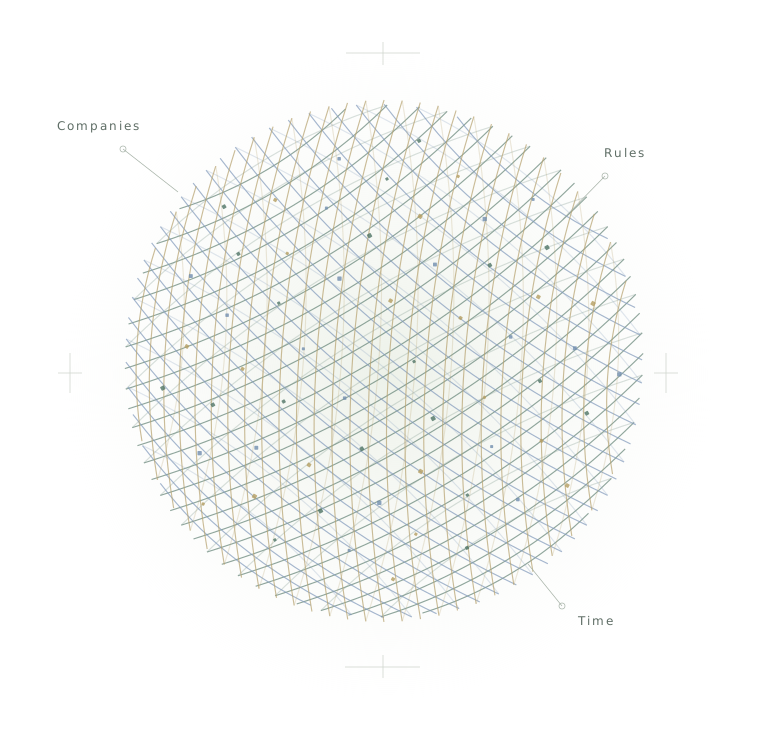
Imagine a street of businesses: a bakery, a pharmacy, a bank and a software company. Buying a share means owning a small part of one business. Buying a broad-market index ETF means holding a group of businesses according to a set of rules.
An index defines who is included and how much each constituent counts, then records their combined performance as a number. The index itself is not an asset you can buy directly. A fund pools investors’ money to buy assets; an ETF is a fund structure whose shares trade on an exchange. Many familiar broad-market ETFs track indices, while other ETFs are actively managed. [1]
A share
Ownership in one company
Who creates the value?An index
Constituents, weights and rules
How are companies combined?An index ETF
A portfolio tracking the list
How can you hold it?Similar names can hide different holdings. Different names can hold the same things.
The S&P 500 is an index. SPY, IVV and VOO are funds from different issuers that track it. Buying all three mainly increases your number of products; it does not automatically triple your diversification. Conversely, the CSI 500 and CSI A500 both contain “500,” but use different selection rules and market coverage.
ASHR trades in the U.S. and invests in Chinese A-shares. A mainland-listed cross-border ETF can invest in the U.S. If you measure a dollar asset’s return in renminbi, exchange-rate movements also enter the calculation.
The same list can produce different results.
Market-cap weighting gives companies with larger investable market values more influence. Equal weighting seeks an even allocation at rebalancing. The Dow Jones Industrial Average uses share-price weighting. If two shares return 10% and 0%, an equal-weight portfolio returns about 5%; if the first share has a 90% weight, the portfolio returns about 9%. Weighting is itself a choice.
Also distinguish a price index from a total-return index. The former primarily tracks price changes; the latter assumes reinvestment of distributions. Omitting dividends can change a long-term comparison. Index levels alone do not tell you whether a market is cheap: each index has its own starting level.
Know the markets
Three markets.
Many ways to see the world.
Start with broad benchmarks that span industries, then explore company size, sectors and strategies. This is a map of roles, not a set of interchangeable portfolios. Similar labels can conceal different industry mixes, valuations, policies and currencies.
Mainland China · A-shares
From size to industry
The CSI 300, CSI 500 and CSI 1000 form successive size segments. The CSI A500 emphasizes industry representation. STAR 50 and ChiNext have distinct board and industry characteristics.
Explore A-shares ↗Hong Kong · Listed equities
Several views of China
The Hang Seng Index spans industries. The Hang Seng China Enterprises Index includes both state-owned and private companies. Hang Seng TECH selects 30 companies meeting its technology-theme criteria.
Explore Hong Kong ↗United States · Listed equities
Beyond the biggest names
The S&P 500 tracks large U.S. companies. Total-market funds extend into mid- and small-cap shares. The Nasdaq-100 selects large non-financial companies; it is not a pure technology index.
Explore U.S. equities ↗Definitions draw on CSI, Hang Seng Indexes, S&P DJI and Nasdaq / Invesco. Providers use different size, sector and country-classification rules. [2–5]
Get to know a few baskets before expanding the map.
Below, historical results sit beside representative fund names. These are fund returns in each product’s currency, using NAV or adjusted market prices as labeled. They are neither index backtests nor forecasts. Each fund has its own observation period. A crisis that a young fund has never experienced is not a test it has passed.
CSI 300
510300 ↗Large A-share companies. The fund has a shorter live history than the index.
- Total return
- +90.40%
- CAGR
- +4.54%
- Max. drawdown
- −45.62%
S&P 500
SPY ↗Large U.S. companies across sectors. Watch concentration in the largest holdings.
- Total return
- +696.34%
- CAGR
- +10.93%
- Max. drawdown
- −55.19%
CSI 500
510500 ↗Mid-cap A-shares drawn from a different universe than the CSI 300.
- Total return
- +89.03%
- CAGR
- +4.74%
- Max. drawdown
- −63.22%
Nasdaq-100
QQQ ↗Large non-financial companies, with strong technology and growth exposure. Sector weights are uneven.
- Total return
- +1812.28%
- CAGR
- +15.90%
- Max. drawdown
- −53.40%
CSI A500
159338 ↗A newer broad benchmark emphasizing industry coverage. A short history is not a full market cycle.
- Total return
- +3.46%
- CAGR
- +1.63%
- Max. drawdown
- −24.00%
Hang Seng Index
2800.HK ↗Listed in 1999; this source starts in 2008. The available record does not cover a full 20 years.
- Total return
- +35.07%
- CAGR
- +1.61%
- Max. drawdown
- −58.57%
Hang Seng TECH
3033.HK ↗Hong Kong-listed technology themes. Even a short history can contain deep losses.
- Total return
- −50.14%
- CAGR
- −10.65%
- Max. drawdown
- −74.73%
Ultra-short U.S. Treasuries
SGOV ↗Ultra-short U.S. Treasuries. Low volatility in dollars does not remove currency risk for other investors.
- Total return
- +20.18%
- CAGR
- +2.90%
- Max. drawdown
- −0.30%
Annualized return means CAGR. Products with less than 20 years use their available history; the first available record may differ from inception. Full dates and drawdown periods appear in the directory. Read the methodology ↓
Put the numbers back into time
Return measures the distance.
Drawdown reveals the terrain.
“It gained a lot” and “I could have held it all the way through” are different statements. First examine wealth growth, then the fall from a previous high. Each chart starts at 100 and preserves the fund’s actual available period. A young fund is never given a fictional 20-year record.
Historical performance explorer
S&P 500 · SPY
- Total return
- +696.34%
- Annualized · CAGR
- +10.93%
- Max. drawdown
- −55.19%
2006-11-03 — 2026-11-03 · 20-year window · 20.00 years · 5,030 daily observations · Adjusted market price
The deepest decline in this record ran from 2007-10-09 → 2009-03-09. Portfolio value fell −55.19% from that peak to the trough. This is the maximum drawdown within the observed period, not a limit on future losses.
The curve uses month-end observations and period endpoints. Maximum drawdown uses all available daily records. The chart does not show every daily move or measure intraday drawdowns. Historical price source ↗
Three numbers answer three different questions.
Total return
How much did it gain?
Ending value ÷ starting value − 1. A rise from 100 to 200 is a 100% total return. Doubling in one year is very different from doubling over twenty.
Annualized compound return · CAGR
What is the yearly equivalent?
(Ending value ÷ starting value)1 / years − 1. Growing from 100 to 200 over ten years implies a CAGR of about 7.18%. It does not mean a 7.18% gain every year.
Maximum drawdown
How far did it fall on the way?
The deepest percentage decline from a previous high to a later low. It describes historical losses, not a ceiling on future losses, and is different from volatility.
Why is there no separate “annualized return” column? The usual geometric annualized return is CAGR. An arithmetic average needs a different label. A 50% gain followed by a 50% loss averages 0% arithmetically, yet wealth falls from 100 to 75. The two-year CAGR is about −13.40%. This guide therefore consistently reports total return, CAGR and maximum drawdown.
Try the arithmetic
A deeper loss needs a bigger recovery.
Changing the denominator changes the answer.
Adjust the loss to see the gain needed to get back to even.
Required recovery = loss ÷ (1 − loss). This is a mathematical example, unrelated to any fund’s future performance.
Consider holding period and starting valuation, too. One chosen 20-year window is not the distribution of all rolling 20-year outcomes. Whether you must sell in a bear market often depends on cash needs and position size, as well as your long-term view.
From the index to your account
You buy one fund.
You experience an entire investment chain.
Index performance, fund NAV, exchange trading price and your actual return are connected but distinct. Understanding the chain is more useful than memorizing more tickers.
Why do ETFs usually trade close to NAV?
Authorized participants can typically create or redeem large blocks of shares using baskets of securities or cash. Arbitrage helps bring the ETF’s trading price toward its net asset value, but does not guarantee a perfect match at every moment. Different market opening hours, investment quotas or impaired liquidity can widen the gap. Retail investors usually trade on the secondary market rather than participate directly in this large-block mechanism. [1]
A premium changes your purchase cost.
If a fund’s assets are worth 100 per share and you pay 110, you pay a 10% premium. If NAV stays constant and the premium disappears, your loss is 10 ÷ 110 ≈ 9.09%. The denominator is your actual purchase price.
A distribution does not create free wealth.
A fund worth 100 distributes 5. Ignoring other changes, its value falls to about 95 and you hold 5 in cash. Distribution yield is not total return: combine changes in fund value with distributions received.
Different baskets carry different risks.
| Product type | Main risk sources | A common misunderstanding |
|---|---|---|
| Broad equity | Earnings, valuation, market and country risks | Many holdings can still be concentrated in a few large companies or sectors. |
| Sector and thematic | Industry cycles, competition and top-holding concentration | A promising industry is not automatically attractively priced. |
| Dividend and factor | Selection rules, style cycles and sector tilts | High dividends do not protect principal; momentum is not a permanent technology allocation. |
| Bonds | Duration, credit, inflation and currency | SGOV and TLT both hold U.S. Treasuries but have very different rate sensitivity. |
| Physical commodities and futures | Spot prices, rolling contracts, margin and structure | Gold, gold-mining shares and gold futures are different exposures. |
| Option income | Equity losses, forgone upside and distribution composition | A high payout is neither a high total return nor fixed interest. |
| Leveraged and inverse | Daily reset, volatility, path and financing costs | Daily 3× exposure does not mean three times the long-term cumulative return. |
Suppose an index rises from 100 to 110, then falls back to 100. Ignoring costs, a 2× daily product first rises from 100 to 120, then falls about 18.18%, ending around 98.18. The index is back where it started; the leveraged product is not. This is path dependence. [6]
An ETN is a different instrument again: usually an issuer’s debt obligation, with additional issuer credit risk. The directory distinguishes active ETFs, commodity trusts, leveraged products and ETNs from ordinary index ETFs. Being exchange-traded does not make their structures equivalent.
A reference to return to
The index and ETF directory.
This preserves the source handout’s breadth: 229 indices, index families or strategies, linked to 236 distinct representative products. Some entries cover different implementations of one theme. This is not an exhaustive list of funds. Every named product has its own calculation; one ETF’s return is never assigned to an entire index category.
229 entries · 236 representative products
Observations through November 3, 2026Returns use each product’s currency. Mainland products use reinvested NAV; others use adjusted market prices, as labeled in every row. CAGR is the annualized compound return. Dates and currencies are specified individually. Different observation periods cannot be ranked directly.
CSI 300
A-share market benchmarksLarge A-share companies listed in Shanghai and Shenzhen.
| Product / currency | Total return | CAGR | Max. drawdown | Period |
|---|---|---|---|---|
| 510300 ↗CNY · Renminbi · NAV, reinvested | +90.40% | +4.54% | −45.62% | 2012-05-04 — 2026-11-03Available history · 14.50 years |
| 159919 ↗CNY · Renminbi · NAV, reinvested | +98.28% | +4.84% | −45.90% | 2012-05-07 — 2026-11-03Available history · 14.49 years |
View the peak and trough of each maximum drawdown
510300: 2015-06-08 → 2016-01-28, −45.62%. 3,523 daily observations.
159919: 2015-06-08 → 2016-01-28, −45.90%. 3,523 daily observations.
CSI 500
A-share market benchmarksMid-cap A-shares outside the CSI 300 universe.
| Product / currency | Total return | CAGR | Max. drawdown | Period |
|---|---|---|---|---|
| 510500 ↗CNY · Renminbi · NAV, reinvested | +89.03% | +4.74% | −63.22% | 2013-02-06 — 2026-11-03Available history · 13.74 years |
| 159922 ↗CNY · Renminbi · NAV, reinvested | +115.84% | +5.76% | −63.19% | 2013-02-06 — 2026-11-03Available history · 13.74 years |
View the peak and trough of each maximum drawdown
510500: 2015-06-12 → 2018-10-18, −63.22%. 3,327 daily observations.
159922: 2015-06-12 → 2018-10-18, −63.19%. 3,327 daily observations.
CSI 1000
A-share market benchmarksSmaller A-shares outside the CSI 800 universe.
| Product / currency | Total return | CAGR | Max. drawdown | Period |
|---|---|---|---|---|
| 512100 ↗CNY · Renminbi · NAV, reinvested | −4.77% | −0.48% | −51.69% | 2016-09-29 — 2026-11-03Available history · 10.10 years |
| 159845 ↗CNY · Renminbi · NAV, reinvested | −31.60% | −6.52% | −54.45% | 2021-03-18 — 2026-11-03Available history · 5.63 years |
View the peak and trough of each maximum drawdown
512100: 2016-11-22 → 2018-10-18, −51.69%. 2,441 daily observations.
159845: 2021-03-19 → 2024-02-05, −54.45%. 1,363 daily observations.
CSI 2000
A-share market benchmarksA further tier of small A-share companies.
| Product / currency | Total return | CAGR | Max. drawdown | Period |
|---|---|---|---|---|
| 159531 ↗CNY · Renminbi · NAV, reinvested | +23.42% | +6.89% | −36.52% | 2023-09-07 — 2026-11-03Available history · 3.16 years |
View the peak and trough of each maximum drawdown
159531: 2023-11-20 → 2024-02-07, −36.52%. 759 daily observations.
CSI 800
A-share market benchmarksCombines the CSI 300 and CSI 500.
| Product / currency | Total return | CAGR | Max. drawdown | Period |
|---|---|---|---|---|
| 515800 ↗CNY · Renminbi · NAV, reinvested | +23.54% | +3.03% | −37.65% | 2019-10-08 — 2026-11-03Available history · 7.07 years |
View the peak and trough of each maximum drawdown
515800: 2021-02-19 → 2024-02-05, −37.65%. 1,691 daily observations.
CSI All Share
A-share market benchmarksA broad view of eligible mainland-listed A-shares.
This is an index or strategy category without a single specified representative product. Consult the official fund directories for a specific fund.
CNI 2000
A-share market benchmarksA small-cap benchmark with its own selection rules.
| Product / currency | Total return | CAGR | Max. drawdown | Period |
|---|---|---|---|---|
| 159628 ↗CNY · Renminbi · NAV, reinvested | +14.21% | +3.10% | −35.89% | 2022-06-29 — 2026-11-03Available history · 4.35 years |
View the peak and trough of each maximum drawdown
159628: 2023-04-07 → 2024-02-05, −35.89%. 1,049 daily observations.
CSI A500
A-share cross-sector benchmarksA broad benchmark emphasizing industry representation.
| Product / currency | Total return | CAGR | Max. drawdown | Period |
|---|---|---|---|---|
| 159338 ↗CNY · Renminbi · NAV, reinvested | +3.46% | +1.63% | −24.00% | 2024-09-26 — 2026-11-03Available history · 2.10 years |
View the peak and trough of each maximum drawdown
159338: 2026-06-22 → 2026-10-30, −24.00%. 502 daily observations.
CSI A50
A-share cross-sector benchmarksFifty leading A-share companies across industries.
This is an index or strategy category without a single specified representative product. Consult the official fund directories for a specific fund.
CSI A100 (formerly CSI 100)
A-share cross-sector benchmarksOne hundred large A-share companies under the revised methodology.
| Product / currency | Total return | CAGR | Max. drawdown | Period |
|---|---|---|---|---|
| 159923 ↗CNY · Renminbi · NAV, reinvested | +87.01% | +4.66% | −46.94% | 2013-02-07 — 2026-11-03Available history · 13.74 years |
View the peak and trough of each maximum drawdown
159923: 2021-02-10 → 2024-02-02, −46.94%. 3,335 daily observations.
FTSE China A50
A-share cross-sector benchmarksFifty large mainland-listed A-share companies.
| Product / currency | Total return | CAGR | Max. drawdown | Period |
|---|---|---|---|---|
| 2822.HK ↗HKD · Hong Kong dollar · Adjusted market price | +160.12% | +6.97% | −51.20% | 2012-08-28 — 2026-11-02Available history · 14.18 years |
| 2823.HK ↗HKD · Hong Kong dollar · Adjusted market price | +25.00% | +9.24% | −27.66% | 2024-04-24 — 2026-11-02Available history · 2.52 years |
View the peak and trough of each maximum drawdown
2822.HK: 2021-02-16 → 2024-01-17, −51.20%. 3,486 daily observations.
2823.HK: 2024-10-07 → 2025-04-07, −27.66%. 620 daily observations.
MSCI China A 50 Connect
A-share cross-sector benchmarksFifty A-shares eligible for Stock Connect, with sector representation.
| Product / currency | Total return | CAGR | Max. drawdown | Period |
|---|---|---|---|---|
| 560050 ↗CNY · Renminbi · NAV, reinvested | −6.71% | −1.38% | −38.61% | 2021-10-29 — 2026-11-03Available history · 5.01 years |
View the peak and trough of each maximum drawdown
560050: 2021-12-13 → 2024-02-02, −38.61%. 1,215 daily observations.
CSI Shanghai–Shenzhen–Hong Kong 500
A-share cross-sector benchmarksA cross-market universe spanning mainland China and Hong Kong.
This is an index or strategy category without a single specified representative product. Consult the official fund directories for a specific fund.
SSE Composite
A-share exchanges and boardsEligible Shanghai-listed A- and B-shares.
| Product / currency | Total return | CAGR | Max. drawdown | Period |
|---|---|---|---|---|
| 510210 ↗CNY · Renminbi · NAV, reinvested | +97.91% | +4.43% | −47.18% | 2011-01-30 — 2026-11-03Available history · 15.76 years |
View the peak and trough of each maximum drawdown
510210: 2015-06-12 → 2016-01-28, −47.18%. 3,813 daily observations.
SSE 50
A-share exchanges and boardsFifty large, liquid Shanghai-listed companies.
| Product / currency | Total return | CAGR | Max. drawdown | Period |
|---|---|---|---|---|
| 510050 ↗CNY · Renminbi · NAV, reinvested | +224.02% | +6.05% | −70.23% | 2006-11-03 — 2026-11-0320-year window · 20.00 years |
View the peak and trough of each maximum drawdown
510050: 2007-10-16 → 2008-10-27, −70.23%. 4,879 daily observations.
SSE 180
A-share exchanges and boardsA broader selection of major Shanghai-listed companies.
| Product / currency | Total return | CAGR | Max. drawdown | Period |
|---|---|---|---|---|
| 510180 ↗CNY · Renminbi · NAV, reinvested | +266.25% | +6.71% | −71.03% | 2006-11-03 — 2026-11-0320-year window · 20.00 years |
View the peak and trough of each maximum drawdown
510180: 2007-10-16 → 2008-11-04, −71.03%. 4,879 daily observations.
SZSE Component
A-share exchanges and boardsA representative benchmark of Shenzhen-listed companies.
| Product / currency | Total return | CAGR | Max. drawdown | Period |
|---|---|---|---|---|
| 159943 ↗CNY · Renminbi · NAV, reinvested | −6.09% | −0.55% | −49.99% | 2015-06-05 — 2026-11-03Available history · 11.41 years |
View the peak and trough of each maximum drawdown
159943: 2015-06-11 → 2019-01-03, −49.99%. 2,769 daily observations.
SZSE 100 and SZSE 50
A-share exchanges and boardsLarge Shenzhen-listed companies, with different constituent counts.
| Product / currency | Total return | CAGR | Max. drawdown | Period |
|---|---|---|---|---|
| 159901 ↗CNY · Renminbi · NAV, reinvested | +302.54% | +7.21% | −71.39% | 2006-11-03 — 2026-11-0320-year window · 20.00 years |
View the peak and trough of each maximum drawdown
159901: 2007-10-16 → 2008-11-04, −71.39%. 4,879 daily observations.
SME 100
A-share exchanges and boardsA benchmark associated with the former SME Board.
| Product / currency | Total return | CAGR | Max. drawdown | Period |
|---|---|---|---|---|
| 159902 ↗CNY · Renminbi · NAV, reinvested | +294.98% | +7.11% | −65.36% | 2006-11-03 — 2026-11-0320-year window · 20.00 years |
View the peak and trough of each maximum drawdown
159902: 2008-01-15 → 2008-10-27, −65.36%. 4,879 daily observations.
ChiNext 100
A-share exchanges and boardsA representative index of the ChiNext market.
| Product / currency | Total return | CAGR | Max. drawdown | Period |
|---|---|---|---|---|
| 159915 ↗CNY · Renminbi · NAV, reinvested | +175.78% | +6.94% | −69.67% | 2011-09-20 — 2026-11-03Available history · 15.12 years |
View the peak and trough of each maximum drawdown
159915: 2015-06-03 → 2018-10-18, −69.67%. 3,648 daily observations.
ChiNext 50
A-share exchanges and boardsA more concentrated ChiNext selection.
| Product / currency | Total return | CAGR | Max. drawdown | Period |
|---|---|---|---|---|
| 159949 ↗CNY · Renminbi · NAV, reinvested | +8.16% | +0.76% | −59.07% | 2016-06-30 — 2026-11-03Available history · 10.34 years |
View the peak and trough of each maximum drawdown
159949: 2021-07-21 → 2024-02-02, −59.07%. 2,508 daily observations.
STAR 50
A-share exchanges and boardsFifty prominent companies on the STAR Market.
| Product / currency | Total return | CAGR | Max. drawdown | Period |
|---|---|---|---|---|
| 588000 ↗CNY · Renminbi · NAV, reinvested | −15.50% | −2.72% | −59.67% | 2020-09-28 — 2026-11-03Available history · 6.10 years |
View the peak and trough of each maximum drawdown
588000: 2021-07-08 → 2024-09-23, −59.67%. 1,458 daily observations.
STAR 100 and STAR 200
A-share exchanges and boardsAdditional size segments of the STAR Market.
| Product / currency | Total return | CAGR | Max. drawdown | Period |
|---|---|---|---|---|
| 588190 ↗CNY · Renminbi · NAV, reinvested | +24.18% | +7.09% | −44.01% | 2023-09-06 — 2026-11-03Available history · 3.16 years |
View the peak and trough of each maximum drawdown
588190: 2026-06-30 → 2026-11-03, −44.01%. 760 daily observations.
STAR Composite
A-share exchanges and boardsA broader view of eligible STAR Market companies.
This is an index or strategy category without a single specified representative product. Consult the official fund directories for a specific fund.
STAR & ChiNext 50
A-share exchanges and boardsA combined selection from the two innovation-focused boards.
| Product / currency | Total return | CAGR | Max. drawdown | Period |
|---|---|---|---|---|
| 588400 ↗CNY · Renminbi · NAV, reinvested | −28.73% | −6.12% | −59.66% | 2021-06-25 — 2026-11-03Available history · 5.36 years |
View the peak and trough of each maximum drawdown
588400: 2021-07-21 → 2024-09-23, −59.66%. 1,299 daily observations.
Consumer staples
A-share consumer and financial sectorsA-share companies supplying everyday consumer needs.
| Product / currency | Total return | CAGR | Max. drawdown | Period |
|---|---|---|---|---|
| 159928 ↗CNY · Renminbi · NAV, reinvested | +182.93% | +8.20% | −59.99% | 2013-08-23 — 2026-11-03Available history · 13.20 years |
View the peak and trough of each maximum drawdown
159928: 2021-02-10 → 2026-06-26, −59.99%. 3,202 daily observations.
Consumer discretionary
A-share consumer and financial sectorsBusinesses whose sales are more sensitive to discretionary spending.
This is an index or strategy category without a single specified representative product. Consult the official fund directories for a specific fund.
Food, beverages and liquor
A-share consumer and financial sectorsRelated consumer themes with different concentrations.
| Product / currency | Total return | CAGR | Max. drawdown | Period |
|---|---|---|---|---|
| 515170 ↗CNY · Renminbi · NAV, reinvested | −50.77% | −11.42% | −59.68% | 2020-12-30 — 2026-11-03Available history · 5.84 years |
| 512690 ↗CNY · Renminbi · NAV, reinvested | +24.00% | +2.88% | −66.20% | 2019-04-04 — 2026-11-03Available history · 7.58 years |
View the peak and trough of each maximum drawdown
515170: 2021-02-10 → 2026-06-26, −59.68%. 1,413 daily observations.
512690: 2021-06-07 → 2026-07-09, −66.20%. 1,830 daily observations.
Home appliances
A-share consumer and financial sectorsManufacturers and other eligible appliance businesses.
| Product / currency | Total return | CAGR | Max. drawdown | Period |
|---|---|---|---|---|
| 159996 ↗CNY · Renminbi · NAV, reinvested | +34.03% | +4.48% | −39.19% | 2020-02-27 — 2026-11-03Available history · 6.68 years |
View the peak and trough of each maximum drawdown
159996: 2021-01-13 → 2022-10-31, −39.19%. 1,617 daily observations.
Tourism and hotels
A-share consumer and financial sectorsTravel, hospitality and related services.
This is an index or strategy category without a single specified representative product. Consult the official fund directories for a specific fund.
Agriculture
A-share consumer and financial sectorsCompanies across agricultural production and services.
This is an index or strategy category without a single specified representative product. Consult the official fund directories for a specific fund.
Livestock breeding
A-share consumer and financial sectorsLivestock and related agricultural supply chains.
This is an index or strategy category without a single specified representative product. Consult the official fund directories for a specific fund.
Banking
A-share consumer and financial sectorsListed banks; credit conditions and the rate cycle matter.
| Product / currency | Total return | CAGR | Max. drawdown | Period |
|---|---|---|---|---|
| 512800 ↗CNY · Renminbi · NAV, reinvested | +75.67% | +6.25% | −27.83% | 2017-07-18 — 2026-11-03Available history · 9.29 years |
View the peak and trough of each maximum drawdown
512800: 2018-02-05 → 2018-07-02, −27.83%. 2,263 daily observations.
Securities companies
A-share consumer and financial sectorsBrokerages and other eligible securities businesses.
| Product / currency | Total return | CAGR | Max. drawdown | Period |
|---|---|---|---|---|
| 512000 ↗CNY · Renminbi · NAV, reinvested | −2.48% | −0.25% | −46.05% | 2016-08-30 — 2026-11-03Available history · 10.18 years |
View the peak and trough of each maximum drawdown
512000: 2016-11-14 → 2018-10-18, −46.05%. 2,472 daily observations.
Financials, property and non-bank financials
A-share consumer and financial sectorsRelated sector families with different constituent boundaries.
This is an index or strategy category without a single specified representative product. Consult the official fund directories for a specific fund.
Health care
A-share health care and traditional industriesA broad selection of A-share health care companies.
| Product / currency | Total return | CAGR | Max. drawdown | Period |
|---|---|---|---|---|
| 512010 ↗CNY · Renminbi · NAV, reinvested | +51.36% | +3.21% | −65.39% | 2013-09-23 — 2026-11-03Available history · 13.11 years |
| 159938 ↗CNY · Renminbi · NAV, reinvested | +25.62% | +1.93% | −56.18% | 2014-12-01 — 2026-11-03Available history · 11.92 years |
View the peak and trough of each maximum drawdown
512010: 2021-02-10 → 2024-09-23, −65.39%. 3,184 daily observations.
159938: 2021-07-01 → 2024-09-23, −56.18%. 2,887 daily observations.
Medical services and equipment
A-share health care and traditional industriesMedical services, devices and related businesses.
| Product / currency | Total return | CAGR | Max. drawdown | Period |
|---|---|---|---|---|
| 512170 ↗CNY · Renminbi · NAV, reinvested | +0.63% | +0.08% | −71.90% | 2019-05-20 — 2026-11-03Available history · 7.46 years |
View the peak and trough of each maximum drawdown
512170: 2021-07-01 → 2024-09-18, −71.90%. 1,814 daily observations.
Innovative drugs
A-share health care and traditional industriesCompanies involved in innovative drug development.
| Product / currency | Total return | CAGR | Max. drawdown | Period |
|---|---|---|---|---|
| 515120 ↗CNY · Renminbi · NAV, reinvested | −40.88% | −8.50% | −62.62% | 2020-12-03 — 2026-11-03Available history · 5.92 years |
View the peak and trough of each maximum drawdown
515120: 2021-05-17 → 2024-07-04, −62.62%. 1,421 daily observations.
Traditional Chinese medicine
A-share health care and traditional industriesCompanies in the traditional Chinese medicine industry.
This is an index or strategy category without a single specified representative product. Consult the official fund directories for a specific fund.
Biotechnology
A-share health care and traditional industriesBiological research and related commercial applications.
This is an index or strategy category without a single specified representative product. Consult the official fund directories for a specific fund.
Defense
A-share health care and traditional industriesCompanies linked to defense manufacturing and supply chains.
| Product / currency | Total return | CAGR | Max. drawdown | Period |
|---|---|---|---|---|
| 512660 ↗CNY · Renminbi · NAV, reinvested | +0.47% | +0.05% | −51.18% | 2016-07-26 — 2026-11-03Available history · 10.27 years |
View the peak and trough of each maximum drawdown
512660: 2021-11-30 → 2024-02-05, −51.18%. 2,495 daily observations.
Automotive supply chains
A-share health care and traditional industriesVehicles, components and related businesses.
This is an index or strategy category without a single specified representative product. Consult the official fund directories for a specific fund.
Machinery and machine tools
A-share health care and traditional industriesIndustrial machinery and precision manufacturing equipment.
This is an index or strategy category without a single specified representative product. Consult the official fund directories for a specific fund.
Infrastructure and construction materials
A-share health care and traditional industriesConstruction activity and its upstream suppliers.
This is an index or strategy category without a single specified representative product. Consult the official fund directories for a specific fund.
Real estate
A-share health care and traditional industriesListed property businesses; financing and policy exposure can be substantial.
| Product / currency | Total return | CAGR | Max. drawdown | Period |
|---|---|---|---|---|
| 512200 ↗CNY · Renminbi · NAV, reinvested | −59.76% | −9.43% | −64.94% | 2017-08-25 — 2026-11-03Available history · 9.19 years |
View the peak and trough of each maximum drawdown
512200: 2018-01-23 → 2024-08-28, −64.94%. 2,220 daily observations.
Transportation and logistics
A-share health care and traditional industriesPassenger, freight and logistics businesses.
This is an index or strategy category without a single specified representative product. Consult the official fund directories for a specific fund.
Semiconductor products and equipment
A-share technologyChip design, manufacturing, equipment and related businesses.
| Product / currency | Total return | CAGR | Max. drawdown | Period |
|---|---|---|---|---|
| 512480 ↗CNY · Renminbi · NAV, reinvested | +181.44% | +14.81% | −62.42% | 2019-05-08 — 2026-11-03Available history · 7.49 years |
View the peak and trough of each maximum drawdown
512480: 2021-07-30 → 2024-02-05, −62.42%. 1,806 daily observations.
CNI Semiconductor Chips
A-share technologyA semiconductor selection under CNI methodology.
| Product / currency | Total return | CAGR | Max. drawdown | Period |
|---|---|---|---|---|
| 159995 ↗CNY · Renminbi · NAV, reinvested | +52.28% | +6.39% | −61.56% | 2020-01-20 — 2026-11-03Available history · 6.79 years |
View the peak and trough of each maximum drawdown
159995: 2021-07-30 → 2024-02-05, −61.56%. 1,641 daily observations.
Electronics and consumer hardware
A-share technologyElectronic components and consumer-device supply chains.
This is an index or strategy category without a single specified representative product. Consult the official fund directories for a specific fund.
Computers and software
A-share technologyHardware, software and information-technology services.
| Product / currency | Total return | CAGR | Max. drawdown | Period |
|---|---|---|---|---|
| 512720 ↗CNY · Renminbi · NAV, reinvested | +6.56% | +0.87% | −56.44% | 2019-07-11 — 2026-11-03Available history · 7.32 years |
| 515230 ↗CNY · Renminbi · NAV, reinvested | −36.61% | −7.63% | −59.19% | 2021-02-03 — 2026-11-03Available history · 5.75 years |
View the peak and trough of each maximum drawdown
512720: 2020-07-13 → 2024-08-27, −56.44%. 1,757 daily observations.
515230: 2023-04-04 → 2024-08-27, −59.19%. 1,386 daily observations.
Cloud computing and big data
A-share technologyBusinesses supplying computing infrastructure and data services.
| Product / currency | Total return | CAGR | Max. drawdown | Period |
|---|---|---|---|---|
| 516510 ↗CNY · Renminbi · NAV, reinvested | +35.65% | +5.60% | −50.87% | 2021-03-29 — 2026-11-03Available history · 5.60 years |
View the peak and trough of each maximum drawdown
516510: 2023-06-20 → 2024-02-05, −50.87%. 1,359 daily observations.
Artificial intelligence
A-share technologyAn AI-themed equity selection; holdings depend on the index rules.
| Product / currency | Total return | CAGR | Max. drawdown | Period |
|---|---|---|---|---|
| 515070 ↗CNY · Renminbi · NAV, reinvested | +64.86% | +7.51% | −51.22% | 2019-12-09 — 2026-11-03Available history · 6.90 years |
View the peak and trough of each maximum drawdown
515070: 2020-07-13 → 2024-02-05, −51.22%. 1,669 daily observations.
Robotics
A-share technologyRobotics equipment, components and related automation businesses.
| Product / currency | Total return | CAGR | Max. drawdown | Period |
|---|---|---|---|---|
| 562500 ↗CNY · Renminbi · NAV, reinvested | −16.84% | −3.71% | −45.96% | 2021-12-17 — 2026-11-03Available history · 4.88 years |
View the peak and trough of each maximum drawdown
562500: 2021-12-28 → 2024-08-27, −45.96%. 1,179 daily observations.
5G and communications
A-share technologyTelecommunications equipment and related supply chains.
| Product / currency | Total return | CAGR | Max. drawdown | Period |
|---|---|---|---|---|
| 515050 ↗CNY · Renminbi · NAV, reinvested | +91.07% | +9.51% | −55.65% | 2019-09-17 — 2026-11-03Available history · 7.13 years |
View the peak and trough of each maximum drawdown
515050: 2026-06-25 → 2026-11-03, −55.65%. 1,720 daily observations.
Domestic IT and cybersecurity
A-share technologyDomestic computing systems and information security themes.
This is an index or strategy category without a single specified representative product. Consult the official fund directories for a specific fund.
Media, animation and gaming
A-share technologyContent, entertainment and interactive media businesses.
| Product / currency | Total return | CAGR | Max. drawdown | Period |
|---|---|---|---|---|
| 512980 ↗CNY · Renminbi · NAV, reinvested | −20.18% | −2.51% | −53.21% | 2017-12-27 — 2026-11-03Available history · 8.85 years |
| 159869 ↗CNY · Renminbi · NAV, reinvested | +4.72% | +0.81% | −57.71% | 2021-02-25 — 2026-11-03Available history · 5.69 years |
View the peak and trough of each maximum drawdown
512980: 2020-07-13 → 2022-10-25, −53.21%. 2,128 daily observations.
159869: 2023-06-20 → 2024-07-24, −57.71%. 1,379 daily observations.
Financial technology
A-share technologyTechnology supporting financial services.
This is an index or strategy category without a single specified representative product. Consult the official fund directories for a specific fund.
New energy
A-share energy, resources and emerging themesA broad family of alternative-energy equity themes.
This is an index or strategy category without a single specified representative product. Consult the official fund directories for a specific fund.
Solar photovoltaics
A-share energy, resources and emerging themesCompanies across the solar power supply chain.
| Product / currency | Total return | CAGR | Max. drawdown | Period |
|---|---|---|---|---|
| 515790 ↗CNY · Renminbi · NAV, reinvested | −30.63% | −6.00% | −66.98% | 2020-12-07 — 2026-11-03Available history · 5.91 years |
View the peak and trough of each maximum drawdown
515790: 2021-08-30 → 2025-04-07, −66.98%. 1,428 daily observations.
Wind power
A-share energy, resources and emerging themesWind generation equipment and related suppliers.
| Product / currency | Total return | CAGR | Max. drawdown | Period |
|---|---|---|---|---|
| 159611 ↗CNY · Renminbi · NAV, reinvested | +3.40% | +0.69% | −22.57% | 2021-12-29 — 2026-11-03Available history · 4.85 years |
View the peak and trough of each maximum drawdown
159611: 2021-12-31 → 2022-04-26, −22.57%. 1,173 daily observations.
New-energy vehicles and batteries
A-share energy, resources and emerging themesElectric mobility and battery supply chains.
| Product / currency | Total return | CAGR | Max. drawdown | Period |
|---|---|---|---|---|
| 515030 ↗CNY · Renminbi · NAV, reinvested | +31.55% | +4.18% | −67.03% | 2020-02-20 — 2026-11-03Available history · 6.70 years |
| 159755 ↗CNY · Renminbi · NAV, reinvested | −24.57% | −5.10% | −67.63% | 2021-06-15 — 2026-11-03Available history · 5.38 years |
View the peak and trough of each maximum drawdown
515030: 2021-11-09 → 2024-08-23, −67.03%. 1,625 daily observations.
159755: 2021-11-29 → 2024-02-05, −67.63%. 1,306 daily observations.
Power utilities and green electricity
A-share energy, resources and emerging themesElectricity generation, including renewable generation themes.
This is an index or strategy category without a single specified representative product. Consult the official fund directories for a specific fund.
Power grid equipment
A-share energy, resources and emerging themesTransmission, distribution and grid equipment suppliers.
This is an index or strategy category without a single specified representative product. Consult the official fund directories for a specific fund.
Coal, oil and gas equities
A-share energy, resources and emerging themesEnergy-company shares, rather than direct commodity holdings.
| Product / currency | Total return | CAGR | Max. drawdown | Period |
|---|---|---|---|---|
| 515220 ↗CNY · Renminbi · NAV, reinvested | +184.30% | +16.64% | −32.97% | 2020-01-20 — 2026-11-03Available history · 6.79 years |
View the peak and trough of each maximum drawdown
515220: 2021-09-13 → 2021-11-16, −32.97%. 1,629 daily observations.
Nonferrous metals and rare earths
A-share energy, resources and emerging themesMining, refining and related materials businesses.
| Product / currency | Total return | CAGR | Max. drawdown | Period |
|---|---|---|---|---|
| 512400 ↗CNY · Renminbi · NAV, reinvested | +48.38% | +4.36% | −53.14% | 2017-08-03 — 2026-11-03Available history · 9.25 years |
| 516780 ↗CNY · Renminbi · NAV, reinvested | +38.72% | +5.93% | −57.39% | 2021-02-26 — 2026-11-03Available history · 5.68 years |
View the peak and trough of each maximum drawdown
512400: 2021-09-13 → 2024-02-05, −53.14%. 2,236 daily observations.
516780: 2021-09-13 → 2024-02-05, −57.39%. 1,378 daily observations.
Steel and basic chemicals
A-share energy, resources and emerging themesCyclical industrial materials businesses.
| Product / currency | Total return | CAGR | Max. drawdown | Period |
|---|---|---|---|---|
| 515210 ↗CNY · Renminbi · NAV, reinvested | +24.99% | +3.34% | −56.37% | 2020-01-22 — 2026-11-03Available history · 6.78 years |
| 516020 ↗CNY · Renminbi · NAV, reinvested | −27.00% | −5.39% | −59.69% | 2021-02-26 — 2026-11-03Available history · 5.68 years |
View the peak and trough of each maximum drawdown
515210: 2021-09-09 → 2024-09-18, −56.37%. 1,629 daily observations.
516020: 2021-09-15 → 2024-09-13, −59.69%. 1,380 daily observations.
Environmental protection and carbon neutrality
A-share energy, resources and emerging themesEnvironmental services and decarbonization themes.
This is an index or strategy category without a single specified representative product. Consult the official fund directories for a specific fund.
Satellites and commercial space
A-share energy, resources and emerging themesSpace equipment, satellite services and related businesses.
This is an index or strategy category without a single specified representative product. Consult the official fund directories for a specific fund.
Low-altitude aviation
A-share energy, resources and emerging themesBusinesses associated with low-altitude flight and its infrastructure.
This is an index or strategy category without a single specified representative product. Consult the official fund directories for a specific fund.
SSE Dividend
A-share investment stylesDividend-focused Shanghai-listed equities.
| Product / currency | Total return | CAGR | Max. drawdown | Period |
|---|---|---|---|---|
| 510880 ↗CNY · Renminbi · NAV, reinvested | +308.13% | +7.30% | −74.02% | 2006-11-17 — 2026-11-03Available history · 19.96 years |
View the peak and trough of each maximum drawdown
510880: 2007-10-15 → 2008-11-04, −74.02%. 4,844 daily observations.
CSI Dividend
A-share investment stylesAn A-share dividend strategy under CSI selection rules.
| Product / currency | Total return | CAGR | Max. drawdown | Period |
|---|---|---|---|---|
| 515180 ↗CNY · Renminbi · NAV, reinvested | +87.48% | +9.48% | −18.53% | 2019-11-26 — 2026-11-03Available history · 6.94 years |
View the peak and trough of each maximum drawdown
515180: 2021-09-13 → 2022-03-15, −18.53%. 1,673 daily observations.
SZSE Dividend
A-share investment stylesDividend-focused Shenzhen-listed equities.
| Product / currency | Total return | CAGR | Max. drawdown | Period |
|---|---|---|---|---|
| 159905 ↗CNY · Renminbi · NAV, reinvested | +81.27% | +3.79% | −50.07% | 2010-11-05 — 2026-11-03Available history · 15.99 years |
View the peak and trough of each maximum drawdown
159905: 2021-02-10 → 2022-10-31, −50.07%. 3,865 daily observations.
Dividend and low volatility
A-share investment stylesCombines dividend criteria with a volatility screen.
| Product / currency | Total return | CAGR | Max. drawdown | Period |
|---|---|---|---|---|
| 512890 ↗CNY · Renminbi · NAV, reinvested | +148.10% | +12.23% | −16.52% | 2018-12-19 — 2026-11-03Available history · 7.87 years |
View the peak and trough of each maximum drawdown
512890: 2021-09-13 → 2021-11-10, −16.52%. 1,899 daily observations.
Central SOE and state-owned dividends
A-share investment stylesDividend strategies focused on state-owned enterprises.
This is an index or strategy category without a single specified representative product. Consult the official fund directories for a specific fund.
Value
A-share investment stylesSelects companies using valuation-related measures.
This is an index or strategy category without a single specified representative product. Consult the official fund directories for a specific fund.
Growth
A-share investment stylesSelects companies using growth-related measures.
This is an index or strategy category without a single specified representative product. Consult the official fund directories for a specific fund.
Quality and profitability
A-share investment stylesScreens for financial strength or profitability.
This is an index or strategy category without a single specified representative product. Consult the official fund directories for a specific fund.
Free cash flow
A-share investment stylesSelects companies using cash-generation measures.
This is an index or strategy category without a single specified representative product. Consult the official fund directories for a specific fund.
Low volatility and minimum volatility
A-share investment stylesSeeks lower historical volatility using screening or portfolio optimization.
This is an index or strategy category without a single specified representative product. Consult the official fund directories for a specific fund.
Momentum and multi-factor
A-share investment stylesUses price momentum or a combination of investment factors.
This is an index or strategy category without a single specified representative product. Consult the official fund directories for a specific fund.
ESG and green investing
A-share investment stylesApplies environmental, social, governance or green-economy criteria.
This is an index or strategy category without a single specified representative product. Consult the official fund directories for a specific fund.
Hang Seng Index
Hong Kong market benchmarksA broad Hong Kong equity benchmark spanning several industries.
| Product / currency | Total return | CAGR | Max. drawdown | Period |
|---|---|---|---|---|
| 2800.HK ↗HKD · Hong Kong dollar · Adjusted market price | +35.07% | +1.61% | −58.57% | 2008-01-02 — 2026-11-02Available history · 18.83 years |
| 159920 ↗CNY · Renminbi · NAV, reinvested | +45.72% | +2.68% | −47.47% | 2012-08-09 — 2026-11-03Available history · 14.23 years |
View the peak and trough of each maximum drawdown
2800.HK: 2008-01-09 → 2008-10-27, −58.57%. 4,640 daily observations.
159920: 2018-01-23 → 2022-10-31, −47.47%. 3,428 daily observations.
Hang Seng China Enterprises Index
Hong Kong market benchmarksHong Kong-listed Chinese enterprises, including state-owned and private companies.
| Product / currency | Total return | CAGR | Max. drawdown | Period |
|---|---|---|---|---|
| 2828.HK ↗HKD · Hong Kong dollar · Adjusted market price | +39.42% | +14.07% | −22.42% | 2024-04-24 — 2026-11-02Available history · 2.52 years |
| 510900 ↗CNY · Renminbi · NAV, reinvested | +2.54% | +0.18% | −55.09% | 2012-08-09 — 2026-11-03Available history · 14.23 years |
View the peak and trough of each maximum drawdown
2828.HK: 2025-10-02 → 2026-06-26, −22.42%. 621 daily observations.
510900: 2018-01-26 → 2022-10-31, −55.09%. 3,384 daily observations.
Hang Seng TECH Index
Hong Kong market benchmarksThirty eligible technology-themed Hong Kong-listed companies.
| Product / currency | Total return | CAGR | Max. drawdown | Period |
|---|---|---|---|---|
| 3033.HK ↗HKD · Hong Kong dollar · Adjusted market price | −50.14% | −10.65% | −74.73% | 2020-08-27 — 2026-11-02Available history · 6.18 years |
| 3067.HK ↗HKD · Hong Kong dollar · Adjusted market price | −45.10% | −9.32% | −74.46% | 2020-09-14 — 2026-11-02Available history · 6.13 years |
| 513180 ↗CNY · Renminbi · NAV, reinvested | −51.40% | −12.37% | −63.53% | 2021-05-18 — 2026-11-03Available history · 5.46 years |
View the peak and trough of each maximum drawdown
3033.HK: 2021-02-17 → 2022-10-24, −74.73%. 1,518 daily observations.
3067.HK: 2021-02-17 → 2022-10-24, −74.46%. 1,506 daily observations.
513180: 2021-06-28 → 2022-10-24, −63.53%. 1,326 daily observations.
Hang Seng Composite
Hong Kong market benchmarksA broad universe of Hong Kong-listed equities.
This is an index or strategy category without a single specified representative product. Consult the official fund directories for a specific fund.
Hang Seng HK 35
Hong Kong market benchmarksCompanies with a strong connection to the Hong Kong economy.
This is an index or strategy category without a single specified representative product. Consult the official fund directories for a specific fund.
Hang Seng China-Affiliated Corporations
Hong Kong market benchmarksThe red-chip segment of Hong Kong-listed companies.
This is an index or strategy category without a single specified representative product. Consult the official fund directories for a specific fund.
Hang Seng Stock Connect China Enterprises
Hong Kong market benchmarksEligible Chinese enterprises within the Stock Connect universe.
This is an index or strategy category without a single specified representative product. Consult the official fund directories for a specific fund.
Hang Seng Internet & Information Technology
Hong Kong sectors and dividend stylesHong Kong-listed internet and information-technology businesses.
This is an index or strategy category without a single specified representative product. Consult the official fund directories for a specific fund.
CSI Hong Kong Stock Connect Internet
Hong Kong sectors and dividend stylesInternet businesses selected from the eligible Hong Kong universe.
| Product / currency | Total return | CAGR | Max. drawdown | Period |
|---|---|---|---|---|
| 513770 ↗CNY · Renminbi · NAV, reinvested | −36.36% | −9.11% | −53.45% | 2022-02-09 — 2026-11-03Available history · 4.73 years |
View the peak and trough of each maximum drawdown
513770: 2025-09-30 → 2026-10-29, −53.45%. 1,148 daily observations.
Hang Seng Healthcare
Hong Kong sectors and dividend stylesHong Kong-listed health care companies.
This is an index or strategy category without a single specified representative product. Consult the official fund directories for a specific fund.
Hang Seng Biotech (formerly Hong Kong-Listed Biotech)
Hong Kong sectors and dividend stylesBiotechnology companies under the relevant index methodology.
| Product / currency | Total return | CAGR | Max. drawdown | Period |
|---|---|---|---|---|
| 513280 ↗CNY · Renminbi · NAV, reinvested | −1.50% | −0.35% | −50.72% | 2022-07-05 — 2026-11-03Available history · 4.33 years |
View the peak and trough of each maximum drawdown
513280: 2023-01-16 → 2024-04-19, −50.72%. 1,047 daily observations.
Hong Kong Stock Connect innovative drugs
Hong Kong sectors and dividend stylesInnovative-drug businesses eligible under the strategy rules.
This is an index or strategy category without a single specified representative product. Consult the official fund directories for a specific fund.
Hang Seng High Dividend Yield
Hong Kong sectors and dividend stylesHigh-dividend Hong Kong securities; eligible holdings may include REITs.
| Product / currency | Total return | CAGR | Max. drawdown | Period |
|---|---|---|---|---|
| 3110.HK ↗HKD · Hong Kong dollar · Adjusted market price | +176.79% | +7.90% | −34.74% | 2013-06-10 — 2026-11-02Available history · 13.40 years |
View the peak and trough of each maximum drawdown
3110.HK: 2018-01-29 → 2022-10-31, −34.74%. 3,300 daily observations.
Stock Connect high dividend and low volatility
Hong Kong sectors and dividend stylesCombines dividend and volatility screens in the Stock Connect universe.
This is an index or strategy category without a single specified representative product. Consult the official fund directories for a specific fund.
Stock Connect central SOE dividends
Hong Kong sectors and dividend stylesDividend-paying central state-owned enterprises.
This is an index or strategy category without a single specified representative product. Consult the official fund directories for a specific fund.
Hong Kong consumer sectors
Hong Kong sectors and dividend stylesConsumption-related companies; staples and discretionary definitions differ.
This is an index or strategy category without a single specified representative product. Consult the official fund directories for a specific fund.
Hong Kong banks and property
Hong Kong sectors and dividend stylesSeparate sector exposures to banking and real estate.
This is an index or strategy category without a single specified representative product. Consult the official fund directories for a specific fund.
Hang Seng China Semiconductor
Hong Kong sectors and dividend stylesA semiconductor universe spanning eligible Hong Kong and mainland listings.
This is an index or strategy category without a single specified representative product. Consult the official fund directories for a specific fund.
S&P 500
U.S. market benchmarksA committee-selected U.S. large-cap benchmark, not simply the largest 500 shares.
| Product / currency | Total return | CAGR | Max. drawdown | Period |
|---|---|---|---|---|
| VOO ↗USD · U.S. dollar · Adjusted market price | +811.15% | +14.66% | −33.99% | 2010-09-09 — 2026-11-03Available history · 16.15 years |
| IVV ↗USD · U.S. dollar · Adjusted market price | +699.97% | +10.96% | −55.25% | 2006-11-03 — 2026-11-0320-year window · 20.00 years |
| SPY ↗USD · U.S. dollar · Adjusted market price | +696.34% | +10.93% | −55.19% | 2006-11-03 — 2026-11-0320-year window · 20.00 years |
View the peak and trough of each maximum drawdown
VOO: 2020-02-19 → 2020-03-23, −33.99%. 4,063 daily observations.
IVV: 2007-10-09 → 2009-03-09, −55.25%. 5,030 daily observations.
SPY: 2007-10-09 → 2009-03-09, −55.19%. 5,030 daily observations.
U.S. total stock market
U.S. market benchmarksBroad U.S. equity exposure extending beyond large companies.
| Product / currency | Total return | CAGR | Max. drawdown | Period |
|---|---|---|---|---|
| VTI ↗USD · U.S. dollar · Adjusted market price | +687.54% | +10.87% | −55.45% | 2006-11-03 — 2026-11-0320-year window · 20.00 years |
| ITOT ↗USD · U.S. dollar · Adjusted market price | +675.70% | +10.79% | −55.20% | 2006-11-03 — 2026-11-0320-year window · 20.00 years |
| SCHB ↗USD · U.S. dollar · Adjusted market price | +840.58% | +14.09% | −35.27% | 2009-11-03 — 2026-11-03Available history · 17.00 years |
View the peak and trough of each maximum drawdown
VTI: 2007-10-09 → 2009-03-09, −55.45%. 5,030 daily observations.
ITOT: 2007-10-09 → 2009-03-09, −55.20%. 5,030 daily observations.
SCHB: 2020-02-19 → 2020-03-23, −35.27%. 4,276 daily observations.
Dow Jones Industrial Average
U.S. market benchmarksThirty prominent U.S. companies in a price-weighted index.
| Product / currency | Total return | CAGR | Max. drawdown | Period |
|---|---|---|---|---|
| DIA ↗USD · U.S. dollar · Adjusted market price | +569.98% | +9.98% | −51.87% | 2006-11-03 — 2026-11-0320-year window · 20.00 years |
View the peak and trough of each maximum drawdown
DIA: 2007-10-09 → 2009-03-09, −51.87%. 5,030 daily observations.
Nasdaq-100
U.S. market benchmarksLarge non-financial Nasdaq-listed companies; eligible foreign companies are included.
| Product / currency | Total return | CAGR | Max. drawdown | Period |
|---|---|---|---|---|
| QQQ ↗USD · U.S. dollar · Adjusted market price | +1812.28% | +15.90% | −53.40% | 2006-11-03 — 2026-11-0320-year window · 20.00 years |
| QQQM ↗USD · U.S. dollar · Adjusted market price | +141.89% | +15.70% | −35.04% | 2020-10-13 — 2026-11-03Available history · 6.06 years |
View the peak and trough of each maximum drawdown
QQQ: 2007-10-31 → 2008-11-20, −53.40%. 5,030 daily observations.
QQQM: 2021-11-19 → 2022-11-03, −35.04%. 1,522 daily observations.
Nasdaq Composite
U.S. market benchmarksA broader benchmark of eligible Nasdaq-listed securities.
| Product / currency | Total return | CAGR | Max. drawdown | Period |
|---|---|---|---|---|
| ONEQ ↗USD · U.S. dollar · Adjusted market price | +1198.86% | +13.68% | −55.09% | 2006-11-03 — 2026-11-0320-year window · 20.00 years |
View the peak and trough of each maximum drawdown
ONEQ: 2007-10-31 → 2009-03-09, −55.09%. 5,030 daily observations.
Nasdaq Next Generation 100
U.S. market benchmarksEligible non-financial companies beyond the Nasdaq-100.
| Product / currency | Total return | CAGR | Max. drawdown | Period |
|---|---|---|---|---|
| QQQJ ↗USD · U.S. dollar · Adjusted market price | +72.52% | +9.42% | −39.58% | 2020-10-13 — 2026-11-03Available history · 6.06 years |
View the peak and trough of each maximum drawdown
QQQJ: 2021-11-16 → 2022-10-14, −39.58%. 1,522 daily observations.
Russell 3000
U.S. market benchmarksA broad U.S. stock market benchmark.
| Product / currency | Total return | CAGR | Max. drawdown | Period |
|---|---|---|---|---|
| IWV ↗USD · U.S. dollar · Adjusted market price | +655.90% | +10.64% | −55.61% | 2006-11-03 — 2026-11-0320-year window · 20.00 years |
View the peak and trough of each maximum drawdown
IWV: 2007-10-09 → 2009-03-09, −55.61%. 5,030 daily observations.
Russell 1000
U.S. market benchmarksThe large-cap segment of the Russell U.S. universe.
| Product / currency | Total return | CAGR | Max. drawdown | Period |
|---|---|---|---|---|
| IWB ↗USD · U.S. dollar · Adjusted market price | +684.05% | +10.85% | −55.38% | 2006-11-03 — 2026-11-0320-year window · 20.00 years |
View the peak and trough of each maximum drawdown
IWB: 2007-10-09 → 2009-03-09, −55.38%. 5,030 daily observations.
Russell 2000
U.S. market benchmarksThe small-cap segment of the Russell U.S. universe.
| Product / currency | Total return | CAGR | Max. drawdown | Period |
|---|---|---|---|---|
| IWM ↗USD · U.S. dollar · Adjusted market price | +388.15% | +8.25% | −58.64% | 2006-11-03 — 2026-11-0320-year window · 20.00 years |
View the peak and trough of each maximum drawdown
IWM: 2007-07-13 → 2009-03-09, −58.64%. 5,030 daily observations.
S&P MidCap 400
U.S. market benchmarksMid-sized U.S. companies meeting S&P eligibility rules.
| Product / currency | Total return | CAGR | Max. drawdown | Period |
|---|---|---|---|---|
| IJH ↗USD · U.S. dollar · Adjusted market price | +537.39% | +9.70% | −55.06% | 2006-11-03 — 2026-11-0320-year window · 20.00 years |
| MDY ↗USD · U.S. dollar · Adjusted market price | +509.53% | +9.46% | −55.33% | 2006-11-03 — 2026-11-0320-year window · 20.00 years |
View the peak and trough of each maximum drawdown
IJH: 2007-06-04 → 2009-03-09, −55.06%. 5,030 daily observations.
MDY: 2007-07-13 → 2009-03-09, −55.33%. 5,030 daily observations.
S&P SmallCap 600
U.S. market benchmarksSmaller U.S. companies meeting S&P eligibility rules.
| Product / currency | Total return | CAGR | Max. drawdown | Period |
|---|---|---|---|---|
| IJR ↗USD · U.S. dollar · Adjusted market price | +485.29% | +9.24% | −58.15% | 2006-11-03 — 2026-11-0320-year window · 20.00 years |
View the peak and trough of each maximum drawdown
IJR: 2007-07-19 → 2009-03-09, −58.15%. 5,030 daily observations.
S&P 100
U.S. size and styleA selection of major U.S. companies from the S&P 500.
| Product / currency | Total return | CAGR | Max. drawdown | Period |
|---|---|---|---|---|
| OEF ↗USD · U.S. dollar · Adjusted market price | +742.68% | +11.25% | −54.11% | 2006-11-03 — 2026-11-0320-year window · 20.00 years |
View the peak and trough of each maximum drawdown
OEF: 2007-10-09 → 2009-03-09, −54.11%. 5,030 daily observations.
Russell Top 200
U.S. size and styleThe largest-company segment of the Russell U.S. universe.
| Product / currency | Total return | CAGR | Max. drawdown | Period |
|---|---|---|---|---|
| IWL ↗USD · U.S. dollar · Adjusted market price | +903.73% | +14.44% | −32.71% | 2009-09-28 — 2026-11-03Available history · 17.10 years |
View the peak and trough of each maximum drawdown
IWL: 2020-02-19 → 2020-03-23, −32.71%. 4,302 daily observations.
Russell Midcap
U.S. size and styleMid-sized companies within the Russell 1000.
| Product / currency | Total return | CAGR | Max. drawdown | Period |
|---|---|---|---|---|
| IWR ↗USD · U.S. dollar · Adjusted market price | +525.77% | +9.60% | −58.83% | 2006-11-03 — 2026-11-0320-year window · 20.00 years |
View the peak and trough of each maximum drawdown
IWR: 2007-07-13 → 2009-03-09, −58.83%. 5,030 daily observations.
Russell Microcap
U.S. size and styleVery small U.S. companies under Russell methodology.
| Product / currency | Total return | CAGR | Max. drawdown | Period |
|---|---|---|---|---|
| IWC ↗USD · U.S. dollar · Adjusted market price | +300.25% | +7.18% | −64.61% | 2006-11-03 — 2026-11-0320-year window · 20.00 years |
View the peak and trough of each maximum drawdown
IWC: 2007-06-19 → 2009-03-09, −64.61%. 5,030 daily observations.
Russell 1000 Growth
U.S. size and styleGrowth-style companies within the Russell 1000.
| Product / currency | Total return | CAGR | Max. drawdown | Period |
|---|---|---|---|---|
| IWF ↗USD · U.S. dollar · Adjusted market price | +996.60% | +12.72% | −51.28% | 2006-11-03 — 2026-11-0320-year window · 20.00 years |
View the peak and trough of each maximum drawdown
IWF: 2007-10-31 → 2009-03-09, −51.28%. 5,030 daily observations.
Russell 1000 Value
U.S. size and styleValue-style companies within the Russell 1000.
| Product / currency | Total return | CAGR | Max. drawdown | Period |
|---|---|---|---|---|
| IWD ↗USD · U.S. dollar · Adjusted market price | +413.37% | +8.52% | −60.10% | 2006-11-03 — 2026-11-0320-year window · 20.00 years |
View the peak and trough of each maximum drawdown
IWD: 2007-06-04 → 2009-03-09, −60.10%. 5,030 daily observations.
Russell 2000 Growth
U.S. size and styleGrowth-style companies within the Russell 2000.
| Product / currency | Total return | CAGR | Max. drawdown | Period |
|---|---|---|---|---|
| IWO ↗USD · U.S. dollar · Adjusted market price | +439.47% | +8.79% | −57.62% | 2006-11-03 — 2026-11-0320-year window · 20.00 years |
View the peak and trough of each maximum drawdown
IWO: 2007-10-10 → 2009-03-09, −57.62%. 5,030 daily observations.
Russell 2000 Value
U.S. size and styleValue-style companies within the Russell 2000.
| Product / currency | Total return | CAGR | Max. drawdown | Period |
|---|---|---|---|---|
| IWN ↗USD · U.S. dollar · Adjusted market price | +316.60% | +7.40% | −61.55% | 2006-11-03 — 2026-11-0320-year window · 20.00 years |
View the peak and trough of each maximum drawdown
IWN: 2007-06-04 → 2009-03-09, −61.55%. 5,030 daily observations.
S&P 500 Growth and Value
U.S. size and styleStyle segments of the S&P 500 with different selection and weighting rules.
| Product / currency | Total return | CAGR | Max. drawdown | Period |
|---|---|---|---|---|
| IVW ↗USD · U.S. dollar · Adjusted market price | +990.52% | +12.69% | −49.22% | 2006-11-03 — 2026-11-0320-year window · 20.00 years |
| IVE ↗USD · U.S. dollar · Adjusted market price | +413.23% | +8.52% | −61.32% | 2006-11-03 — 2026-11-0320-year window · 20.00 years |
View the peak and trough of each maximum drawdown
IVW: 2007-10-12 → 2009-03-09, −49.22%. 5,030 daily observations.
IVE: 2007-10-09 → 2009-03-09, −61.32%. 5,030 daily observations.
U.S. growth and value
U.S. size and styleSeparate broad growth and value exposures.
| Product / currency | Total return | CAGR | Max. drawdown | Period |
|---|---|---|---|---|
| VUG ↗USD · U.S. dollar · Adjusted market price | +1014.15% | +12.81% | −50.68% | 2006-11-03 — 2026-11-0320-year window · 20.00 years |
| VTV ↗USD · U.S. dollar · Adjusted market price | +487.53% | +9.26% | −59.27% | 2006-11-03 — 2026-11-0320-year window · 20.00 years |
View the peak and trough of each maximum drawdown
VUG: 2007-10-31 → 2009-03-09, −50.68%. 5,030 daily observations.
VTV: 2007-07-13 → 2009-03-05, −59.27%. 5,030 daily observations.
U.S. mid-cap and small-cap
U.S. size and styleSeparate company-size segments of the U.S. market.
| Product / currency | Total return | CAGR | Max. drawdown | Period |
|---|---|---|---|---|
| VO ↗USD · U.S. dollar · Adjusted market price | +531.60% | +9.65% | −58.88% | 2006-11-03 — 2026-11-0320-year window · 20.00 years |
| VB ↗USD · U.S. dollar · Adjusted market price | +500.48% | +9.38% | −59.57% | 2006-11-03 — 2026-11-0320-year window · 20.00 years |
View the peak and trough of each maximum drawdown
VO: 2007-07-13 → 2009-03-09, −58.88%. 5,030 daily observations.
VB: 2007-07-13 → 2009-03-09, −59.57%. 5,030 daily observations.
U.S. extended market
U.S. size and styleU.S. equities outside the S&P 500.
| Product / currency | Total return | CAGR | Max. drawdown | Period |
|---|---|---|---|---|
| VXF ↗USD · U.S. dollar · Adjusted market price | +517.54% | +9.53% | −58.04% | 2006-11-03 — 2026-11-0320-year window · 20.00 years |
View the peak and trough of each maximum drawdown
VXF: 2007-10-09 → 2009-03-09, −58.04%. 5,030 daily observations.
Information technology
The 11 S&P 500 sectorsThe technology sector of the S&P 500.
| Product / currency | Total return | CAGR | Max. drawdown | Period |
|---|---|---|---|---|
| XLK ↗USD · U.S. dollar · Adjusted market price | +1922.46% | +16.22% | −53.04% | 2006-11-03 — 2026-11-0320-year window · 20.00 years |
View the peak and trough of each maximum drawdown
XLK: 2007-10-31 → 2008-11-20, −53.04%. 5,030 daily observations.
Communication services
The 11 S&P 500 sectorsThe communication services sector of the S&P 500.
| Product / currency | Total return | CAGR | Max. drawdown | Period |
|---|---|---|---|---|
| XLC ↗USD · U.S. dollar · Adjusted market price | +120.27% | +9.89% | −46.65% | 2018-06-19 — 2026-11-03Available history · 8.38 years |
View the peak and trough of each maximum drawdown
XLC: 2021-09-01 → 2022-11-03, −46.65%. 2,106 daily observations.
Consumer discretionary
The 11 S&P 500 sectorsThe consumer discretionary sector of the S&P 500.
| Product / currency | Total return | CAGR | Max. drawdown | Period |
|---|---|---|---|---|
| XLY ↗USD · U.S. dollar · Adjusted market price | +725.34% | +11.13% | −59.05% | 2006-11-03 — 2026-11-0320-year window · 20.00 years |
View the peak and trough of each maximum drawdown
XLY: 2007-06-04 → 2009-03-09, −59.05%. 5,030 daily observations.
Consumer staples
The 11 S&P 500 sectorsThe consumer staples sector of the S&P 500.
| Product / currency | Total return | CAGR | Max. drawdown | Period |
|---|---|---|---|---|
| XLP ↗USD · U.S. dollar · Adjusted market price | +493.92% | +9.32% | −32.39% | 2006-11-03 — 2026-11-0320-year window · 20.00 years |
View the peak and trough of each maximum drawdown
XLP: 2008-09-12 → 2009-03-09, −32.39%. 5,030 daily observations.
Health care
The 11 S&P 500 sectorsThe health care sector of the S&P 500.
| Product / currency | Total return | CAGR | Max. drawdown | Period |
|---|---|---|---|---|
| XLV ↗USD · U.S. dollar · Adjusted market price | +685.58% | +10.86% | −39.17% | 2006-11-03 — 2026-11-0320-year window · 20.00 years |
View the peak and trough of each maximum drawdown
XLV: 2007-12-10 → 2009-03-09, −39.17%. 5,030 daily observations.
Financials
The 11 S&P 500 sectorsThe financial sector of the S&P 500.
| Product / currency | Total return | CAGR | Max. drawdown | Period |
|---|---|---|---|---|
| XLF ↗USD · U.S. dollar · Adjusted market price | +196.89% | +5.59% | −82.69% | 2006-11-03 — 2026-11-0320-year window · 20.00 years |
View the peak and trough of each maximum drawdown
XLF: 2007-06-01 → 2009-03-06, −82.69%. 5,030 daily observations.
Industrials
The 11 S&P 500 sectorsThe industrial sector of the S&P 500.
| Product / currency | Total return | CAGR | Max. drawdown | Period |
|---|---|---|---|---|
| XLI ↗USD · U.S. dollar · Adjusted market price | +640.57% | +10.53% | −62.26% | 2006-11-03 — 2026-11-0320-year window · 20.00 years |
View the peak and trough of each maximum drawdown
XLI: 2007-10-09 → 2009-03-09, −62.26%. 5,030 daily observations.
Energy
The 11 S&P 500 sectorsThe energy sector of the S&P 500.
| Product / currency | Total return | CAGR | Max. drawdown | Period |
|---|---|---|---|---|
| XLE ↗USD · U.S. dollar · Adjusted market price | +326.65% | +7.52% | −71.26% | 2006-11-03 — 2026-11-0320-year window · 20.00 years |
View the peak and trough of each maximum drawdown
XLE: 2014-06-23 → 2020-03-18, −71.26%. 5,030 daily observations.
Materials
The 11 S&P 500 sectorsThe materials sector of the S&P 500.
| Product / currency | Total return | CAGR | Max. drawdown | Period |
|---|---|---|---|---|
| XLB ↗USD · U.S. dollar · Adjusted market price | +387.43% | +8.24% | −59.82% | 2006-11-03 — 2026-11-0320-year window · 20.00 years |
View the peak and trough of each maximum drawdown
XLB: 2008-05-20 → 2009-03-02, −59.82%. 5,030 daily observations.
Utilities
The 11 S&P 500 sectorsThe utilities sector of the S&P 500.
| Product / currency | Total return | CAGR | Max. drawdown | Period |
|---|---|---|---|---|
| XLU ↗USD · U.S. dollar · Adjusted market price | +386.07% | +8.23% | −46.48% | 2006-11-03 — 2026-11-0320-year window · 20.00 years |
View the peak and trough of each maximum drawdown
XLU: 2007-12-10 → 2009-03-09, −46.48%. 5,030 daily observations.
Real estate
The 11 S&P 500 sectorsThe real estate sector of the S&P 500.
| Product / currency | Total return | CAGR | Max. drawdown | Period |
|---|---|---|---|---|
| XLRE ↗USD · U.S. dollar · Adjusted market price | +111.10% | +6.98% | −38.82% | 2015-10-08 — 2026-11-03Available history · 11.07 years |
View the peak and trough of each maximum drawdown
XLRE: 2020-02-21 → 2020-03-23, −38.82%. 2,784 daily observations.
Semiconductors
U.S. technology and health careChip-related equity exposure; SMH and SOXX follow different indices.
| Product / currency | Total return | CAGR | Max. drawdown | Period |
|---|---|---|---|---|
| SMH ↗USD · U.S. dollar · Adjusted market price | +3605.23% | +19.80% | −64.19% | 2006-11-03 — 2026-11-0320-year window · 20.00 years |
| SOXX ↗USD · U.S. dollar · Adjusted market price | +2738.93% | +18.21% | −66.85% | 2006-11-03 — 2026-11-0320-year window · 20.00 years |
View the peak and trough of each maximum drawdown
SMH: 2007-07-17 → 2008-11-20, −64.19%. 5,030 daily observations.
SOXX: 2007-07-17 → 2008-11-20, −66.85%. 5,030 daily observations.
North American technology software
U.S. technology and health careSoftware and related technology businesses under the benchmark rules.
| Product / currency | Total return | CAGR | Max. drawdown | Period |
|---|---|---|---|---|
| IGV ↗USD · U.S. dollar · Adjusted market price | +1099.51% | +13.23% | −49.81% | 2006-11-03 — 2026-11-0320-year window · 20.00 years |
View the peak and trough of each maximum drawdown
IGV: 2007-10-31 → 2008-11-20, −49.81%. 5,030 daily observations.
Cybersecurity
U.S. technology and health careBusinesses providing cybersecurity products and services.
| Product / currency | Total return | CAGR | Max. drawdown | Period |
|---|---|---|---|---|
| CIBR ↗USD · U.S. dollar · Adjusted market price | +413.08% | +15.53% | −33.89% | 2015-07-07 — 2026-11-03Available history · 11.33 years |
View the peak and trough of each maximum drawdown
CIBR: 2021-11-12 → 2022-10-14, −33.89%. 2,850 daily observations.
Cloud computing
U.S. technology and health careCompanies involved in cloud computing infrastructure and services.
| Product / currency | Total return | CAGR | Max. drawdown | Period |
|---|---|---|---|---|
| SKYY ↗USD · U.S. dollar · Adjusted market price | +700.14% | +14.53% | −53.20% | 2011-07-06 — 2026-11-03Available history · 15.33 years |
View the peak and trough of each maximum drawdown
SKYY: 2021-11-16 → 2022-12-28, −53.20%. 3,856 daily observations.
Artificial intelligence and big data
U.S. technology and health careBusinesses exposed to AI and data technologies.
| Product / currency | Total return | CAGR | Max. drawdown | Period |
|---|---|---|---|---|
| AIQ ↗USD · U.S. dollar · Adjusted market price | +307.57% | +18.05% | −44.66% | 2018-05-16 — 2026-11-03Available history · 8.47 years |
View the peak and trough of each maximum drawdown
AIQ: 2021-11-16 → 2022-10-14, −44.66%. 2,129 daily observations.
Robotics and automation
U.S. technology and health careGlobal robotics and automation equity themes.
| Product / currency | Total return | CAGR | Max. drawdown | Period |
|---|---|---|---|---|
| BOTZ ↗USD · U.S. dollar · Adjusted market price | +128.18% | +8.48% | −55.54% | 2016-09-13 — 2026-11-03Available history · 10.14 years |
| ROBO ↗USD · U.S. dollar · Adjusted market price | +202.84% | +8.87% | −43.65% | 2013-10-22 — 2026-11-03Available history · 13.03 years |
View the peak and trough of each maximum drawdown
BOTZ: 2021-11-08 → 2022-10-14, −55.54%. 2,550 daily observations.
ROBO: 2021-11-04 → 2022-10-14, −43.65%. 3,278 daily observations.
Internet
U.S. technology and health careInternet-related businesses under the fund's index rules.
| Product / currency | Total return | CAGR | Max. drawdown | Period |
|---|---|---|---|---|
| FDN ↗USD · U.S. dollar · Adjusted market price | +1115.49% | +13.30% | −61.55% | 2006-11-03 — 2026-11-0320-year window · 20.00 years |
View the peak and trough of each maximum drawdown
FDN: 2007-10-12 → 2008-11-20, −61.55%. 5,030 daily observations.
NYSE Biotechnology
U.S. technology and health careBiotechnology and related companies in the tracked benchmark.
| Product / currency | Total return | CAGR | Max. drawdown | Period |
|---|---|---|---|---|
| IBB ↗USD · U.S. dollar · Adjusted market price | +757.70% | +11.34% | −39.82% | 2006-11-03 — 2026-11-0320-year window · 20.00 years |
View the peak and trough of each maximum drawdown
IBB: 2021-08-09 → 2022-06-16, −39.82%. 5,030 daily observations.
S&P Biotechnology Select Industry
U.S. technology and health careA biotechnology selection with a different weighting approach from IBB.
| Product / currency | Total return | CAGR | Max. drawdown | Period |
|---|---|---|---|---|
| XBI ↗USD · U.S. dollar · Adjusted market price | +889.32% | +12.14% | −63.89% | 2006-11-03 — 2026-11-0320-year window · 20.00 years |
View the peak and trough of each maximum drawdown
XBI: 2021-02-08 → 2022-05-11, −63.89%. 5,030 daily observations.
Medical devices
U.S. technology and health careCompanies producing medical devices and equipment.
| Product / currency | Total return | CAGR | Max. drawdown | Period |
|---|---|---|---|---|
| IHI ↗USD · U.S. dollar · Adjusted market price | +650.42% | +10.60% | −49.64% | 2006-11-03 — 2026-11-0320-year window · 20.00 years |
View the peak and trough of each maximum drawdown
IHI: 2008-08-15 → 2009-03-09, −49.64%. 5,030 daily observations.
Pharmaceuticals
U.S. technology and health careDrug manufacturers and related pharmaceutical businesses.
| Product / currency | Total return | CAGR | Max. drawdown | Period |
|---|---|---|---|---|
| IHE ↗USD · U.S. dollar · Adjusted market price | +716.73% | +11.07% | −38.21% | 2006-11-03 — 2026-11-0320-year window · 20.00 years |
View the peak and trough of each maximum drawdown
IHE: 2007-05-22 → 2009-03-05, −38.21%. 5,030 daily observations.
Banks and regional banks
U.S. sectors and themesDifferent slices of the banking industry, with different concentrations.
| Product / currency | Total return | CAGR | Max. drawdown | Period |
|---|---|---|---|---|
| KBE ↗USD · U.S. dollar · Adjusted market price | +90.42% | +3.27% | −83.15% | 2006-11-03 — 2026-11-0320-year window · 20.00 years |
| KRE ↗USD · U.S. dollar · Adjusted market price | +145.71% | +4.60% | −68.54% | 2006-11-03 — 2026-11-0320-year window · 20.00 years |
View the peak and trough of each maximum drawdown
KBE: 2007-02-20 → 2009-03-06, −83.15%. 5,030 daily observations.
KRE: 2006-12-27 → 2009-03-09, −68.54%. 5,030 daily observations.
Insurance
U.S. sectors and themesInsurance and related businesses.
| Product / currency | Total return | CAGR | Max. drawdown | Period |
|---|---|---|---|---|
| KIE ↗USD · U.S. dollar · Adjusted market price | +408.76% | +8.47% | −75.30% | 2006-11-03 — 2026-11-0320-year window · 20.00 years |
View the peak and trough of each maximum drawdown
KIE: 2007-05-16 → 2009-03-09, −75.30%. 5,030 daily observations.
Aerospace and defense
U.S. sectors and themesAircraft, defense systems and related supply chains.
| Product / currency | Total return | CAGR | Max. drawdown | Period |
|---|---|---|---|---|
| ITA ↗USD · U.S. dollar · Adjusted market price | +968.36% | +12.57% | −59.72% | 2006-11-03 — 2026-11-0320-year window · 20.00 years |
| XAR ↗USD · U.S. dollar · Adjusted market price | +993.53% | +17.17% | −46.37% | 2011-09-29 — 2026-11-03Available history · 15.10 years |
View the peak and trough of each maximum drawdown
ITA: 2007-10-09 → 2009-03-09, −59.72%. 5,030 daily observations.
XAR: 2020-02-12 → 2020-03-23, −46.37%. 3,796 daily observations.
U.S. infrastructure
U.S. sectors and themesCompanies positioned around U.S. infrastructure investment.
| Product / currency | Total return | CAGR | Max. drawdown | Period |
|---|---|---|---|---|
| PAVE ↗USD · U.S. dollar · Adjusted market price | +295.01% | +15.29% | −44.08% | 2017-03-08 — 2026-11-03Available history · 9.66 years |
View the peak and trough of each maximum drawdown
PAVE: 2020-01-17 → 2020-03-23, −44.08%. 2,429 daily observations.
Homebuilders
U.S. sectors and themesHome construction and related industries; fund universes differ.
| Product / currency | Total return | CAGR | Max. drawdown | Period |
|---|---|---|---|---|
| ITB ↗USD · U.S. dollar · Adjusted market price | +189.96% | +5.47% | −84.88% | 2006-11-03 — 2026-11-0320-year window · 20.00 years |
| XHB ↗USD · U.S. dollar · Adjusted market price | +274.03% | +6.82% | −78.58% | 2006-11-03 — 2026-11-0320-year window · 20.00 years |
View the peak and trough of each maximum drawdown
ITB: 2007-02-02 → 2009-03-06, −84.88%. 5,030 daily observations.
XHB: 2007-02-02 → 2009-03-09, −78.58%. 5,030 daily observations.
Airlines
U.S. sectors and themesAirlines and other eligible air-travel businesses.
| Product / currency | Total return | CAGR | Max. drawdown | Period |
|---|---|---|---|---|
| JETS ↗USD · U.S. dollar · Adjusted market price | +20.79% | +1.65% | −64.73% | 2015-04-30 — 2026-11-03Available history · 11.51 years |
View the peak and trough of each maximum drawdown
JETS: 2018-01-12 → 2020-05-15, −64.73%. 2,896 daily observations.
Retail
U.S. sectors and themesRetail businesses across eligible formats.
| Product / currency | Total return | CAGR | Max. drawdown | Period |
|---|---|---|---|---|
| XRT ↗USD · U.S. dollar · Adjusted market price | +480.19% | +9.19% | −65.82% | 2006-11-03 — 2026-11-0320-year window · 20.00 years |
View the peak and trough of each maximum drawdown
XRT: 2007-06-01 → 2008-11-20, −65.82%. 5,030 daily observations.
Global clean energy
U.S. sectors and themesClean-energy companies across multiple countries.
| Product / currency | Total return | CAGR | Max. drawdown | Period |
|---|---|---|---|---|
| ICLN ↗USD · U.S. dollar · Adjusted market price | −56.16% | −4.39% | −87.19% | 2008-06-25 — 2026-11-03Available history · 18.36 years |
View the peak and trough of each maximum drawdown
ICLN: 2008-06-25 → 2012-07-25, −87.19%. 4,619 daily observations.
Global solar energy
U.S. sectors and themesEquities across the solar energy supply chain.
| Product / currency | Total return | CAGR | Max. drawdown | Period |
|---|---|---|---|---|
| TAN ↗USD · U.S. dollar · Adjusted market price | −77.40% | −7.70% | −95.29% | 2008-04-15 — 2026-11-03Available history · 18.55 years |
View the peak and trough of each maximum drawdown
TAN: 2008-05-16 → 2012-11-20, −95.29%. 4,669 daily observations.
Lithium and batteries
U.S. sectors and themesLithium mining, processing and battery-related businesses.
| Product / currency | Total return | CAGR | Max. drawdown | Period |
|---|---|---|---|---|
| LIT ↗USD · U.S. dollar · Adjusted market price | +128.14% | +5.20% | −65.91% | 2010-07-23 — 2026-11-03Available history · 16.28 years |
View the peak and trough of each maximum drawdown
LIT: 2021-11-08 → 2025-04-08, −65.91%. 4,096 daily observations.
Uranium and uranium miners
U.S. sectors and themesUranium-related businesses and holdings; fund structures differ.
| Product / currency | Total return | CAGR | Max. drawdown | Period |
|---|---|---|---|---|
| URA ↗USD · U.S. dollar · Adjusted market price | −50.48% | −4.30% | −93.54% | 2010-11-05 — 2026-11-03Available history · 15.99 years |
| URNM ↗USD · U.S. dollar · Adjusted market price | +294.11% | +21.93% | −50.80% | 2019-12-04 — 2026-11-03Available history · 6.92 years |
View the peak and trough of each maximum drawdown
URA: 2011-02-02 → 2020-03-18, −93.54%. 4,022 daily observations.
URNM: 2026-01-28 → 2026-11-03, −50.80%. 1,738 daily observations.
Water
U.S. sectors and themesWater infrastructure, treatment and related businesses.
| Product / currency | Total return | CAGR | Max. drawdown | Period |
|---|---|---|---|---|
| PHO ↗USD · U.S. dollar · Adjusted market price | +381.73% | +8.18% | −55.63% | 2006-11-03 — 2026-11-0320-year window · 20.00 years |
View the peak and trough of each maximum drawdown
PHO: 2008-06-05 → 2009-03-09, −55.63%. 5,030 daily observations.
Listed real estate
U.S. sectors and themesREITs and other listed real estate exposure.
| Product / currency | Total return | CAGR | Max. drawdown | Period |
|---|---|---|---|---|
| VNQ ↗USD · U.S. dollar · Adjusted market price | +198.99% | +5.63% | −73.07% | 2006-11-03 — 2026-11-0320-year window · 20.00 years |
| IYR ↗USD · U.S. dollar · Adjusted market price | +161.05% | +4.91% | −74.13% | 2006-11-03 — 2026-11-0320-year window · 20.00 years |
View the peak and trough of each maximum drawdown
VNQ: 2007-02-07 → 2009-03-06, −73.07%. 5,030 daily observations.
IYR: 2007-02-07 → 2009-03-06, −74.13%. 5,030 daily observations.
S&P 500 Equal Weight
U.S. investment stylesRebalances S&P 500 constituents toward equal weights.
| Product / currency | Total return | CAGR | Max. drawdown | Period |
|---|---|---|---|---|
| RSP ↗USD · U.S. dollar · Adjusted market price | +565.03% | +9.94% | −59.92% | 2006-11-03 — 2026-11-0320-year window · 20.00 years |
View the peak and trough of each maximum drawdown
RSP: 2007-07-19 → 2009-03-09, −59.92%. 5,030 daily observations.
S&P 500 Momentum
U.S. investment stylesSelects S&P 500 companies using momentum measures.
| Product / currency | Total return | CAGR | Max. drawdown | Period |
|---|---|---|---|---|
| SPMO ↗USD · U.S. dollar · Adjusted market price | +499.74% | +17.58% | −30.95% | 2015-10-12 — 2026-11-03Available history · 11.06 years |
View the peak and trough of each maximum drawdown
SPMO: 2020-02-19 → 2020-03-23, −30.95%. 2,782 daily observations.
MSCI USA Momentum
U.S. investment stylesA U.S. momentum strategy under MSCI methodology.
| Product / currency | Total return | CAGR | Max. drawdown | Period |
|---|---|---|---|---|
| MTUM ↗USD · U.S. dollar · Adjusted market price | +539.75% | +14.69% | −34.08% | 2013-04-18 — 2026-11-03Available history · 13.54 years |
View the peak and trough of each maximum drawdown
MTUM: 2020-02-19 → 2020-03-23, −34.08%. 3,408 daily observations.
S&P 500 Low Volatility
U.S. investment stylesSelects lower-volatility shares from the S&P 500.
| Product / currency | Total return | CAGR | Max. drawdown | Period |
|---|---|---|---|---|
| SPLV ↗USD · U.S. dollar · Adjusted market price | +343.30% | +10.08% | −36.26% | 2011-05-05 — 2026-11-03Available history · 15.50 years |
View the peak and trough of each maximum drawdown
SPLV: 2020-02-14 → 2020-03-23, −36.26%. 3,898 daily observations.
MSCI USA Minimum Volatility
U.S. investment stylesUses portfolio optimization to seek lower aggregate volatility.
| Product / currency | Total return | CAGR | Max. drawdown | Period |
|---|---|---|---|---|
| USMV ↗USD · U.S. dollar · Adjusted market price | +435.65% | +11.81% | −33.10% | 2011-10-20 — 2026-11-03Available history · 15.04 years |
View the peak and trough of each maximum drawdown
USMV: 2020-02-14 → 2020-03-23, −33.10%. 3,781 daily observations.
MSCI USA Sector Neutral Quality
U.S. investment stylesA quality screen designed to control sector deviations.
| Product / currency | Total return | CAGR | Max. drawdown | Period |
|---|---|---|---|---|
| QUAL ↗USD · U.S. dollar · Adjusted market price | +434.65% | +13.44% | −34.06% | 2013-07-18 — 2026-11-03Available history · 13.29 years |
View the peak and trough of each maximum drawdown
QUAL: 2020-02-19 → 2020-03-23, −34.06%. 3,345 daily observations.
S&P 500 Quality
U.S. investment stylesSelects companies using quality-related financial measures.
| Product / currency | Total return | CAGR | Max. drawdown | Period |
|---|---|---|---|---|
| SPHQ ↗USD · U.S. dollar · Adjusted market price | +619.98% | +10.37% | −57.83% | 2006-11-03 — 2026-11-0320-year window · 20.00 years |
View the peak and trough of each maximum drawdown
SPHQ: 2007-10-29 → 2008-11-20, −57.83%. 5,030 daily observations.
U.S. enhanced value
U.S. investment stylesA value strategy using multiple valuation measures.
| Product / currency | Total return | CAGR | Max. drawdown | Period |
|---|---|---|---|---|
| VLUE ↗USD · U.S. dollar · Adjusted market price | +438.82% | +13.24% | −39.47% | 2013-04-18 — 2026-11-03Available history · 13.54 years |
View the peak and trough of each maximum drawdown
VLUE: 2020-02-12 → 2020-03-23, −39.47%. 3,408 daily observations.
Dow Jones U.S. Dividend 100
U.S. investment stylesA dividend strategy with financial-quality screening.
| Product / currency | Total return | CAGR | Max. drawdown | Period |
|---|---|---|---|---|
| SCHD ↗USD · U.S. dollar · Adjusted market price | +586.40% | +13.66% | −33.37% | 2011-10-20 — 2026-11-03Available history · 15.04 years |
View the peak and trough of each maximum drawdown
SCHD: 2020-01-23 → 2020-03-23, −33.37%. 3,781 daily observations.
FTSE High Dividend Yield
U.S. investment stylesU.S. equities with relatively high expected dividend yields.
| Product / currency | Total return | CAGR | Max. drawdown | Period |
|---|---|---|---|---|
| VYM ↗USD · U.S. dollar · Adjusted market price | +493.21% | +9.33% | −56.98% | 2006-11-16 — 2026-11-03Available history · 19.96 years |
View the peak and trough of each maximum drawdown
VYM: 2007-10-09 → 2009-03-05, −56.98%. 5,021 daily observations.
S&P U.S. Dividend Growers
U.S. investment stylesCompanies with a qualifying record of dividend growth.
| Product / currency | Total return | CAGR | Max. drawdown | Period |
|---|---|---|---|---|
| VIG ↗USD · U.S. dollar · Adjusted market price | +606.31% | +10.27% | −46.81% | 2006-11-03 — 2026-11-0320-year window · 20.00 years |
View the peak and trough of each maximum drawdown
VIG: 2007-10-09 → 2009-03-09, −46.81%. 5,030 daily observations.
S&P 500 Dividend Aristocrats
U.S. investment stylesS&P 500 companies with a qualifying record of annual dividend increases.
| Product / currency | Total return | CAGR | Max. drawdown | Period |
|---|---|---|---|---|
| NOBL ↗USD · U.S. dollar · Adjusted market price | +281.27% | +10.79% | −35.43% | 2013-10-10 — 2026-11-03Available history · 13.06 years |
View the peak and trough of each maximum drawdown
NOBL: 2020-01-17 → 2020-03-23, −35.43%. 3,286 daily observations.
Free cash flow yield
U.S. investment stylesSelects companies using free-cash-flow yield criteria.
| Product / currency | Total return | CAGR | Max. drawdown | Period |
|---|---|---|---|---|
| COWZ ↗USD · U.S. dollar · Adjusted market price | +246.53% | +13.43% | −38.63% | 2016-12-22 — 2026-11-03Available history · 9.87 years |
View the peak and trough of each maximum drawdown
COWZ: 2020-01-17 → 2020-03-23, −38.63%. 2,479 daily observations.
Buybacks and multi-factor
U.S. investment stylesDistinct strategies based on share repurchases or multiple factors.
| Product / currency | Total return | CAGR | Max. drawdown | Period |
|---|---|---|---|---|
| PKW ↗USD · U.S. dollar · Adjusted market price | +642.25% | +10.61% | −54.58% | 2006-12-20 — 2026-11-03Available history · 19.87 years |
| LRGF ↗USD · U.S. dollar · Adjusted market price | +274.59% | +12.15% | −36.03% | 2015-04-30 — 2026-11-03Available history · 11.51 years |
View the peak and trough of each maximum drawdown
PKW: 2007-06-04 → 2009-03-09, −54.58%. 4,998 daily observations.
LRGF: 2020-02-19 → 2020-03-23, −36.03%. 2,896 daily observations.
FTSE Global All Cap
U.S.-listed funds investing worldwideDeveloped and emerging equity markets across company sizes.
| Product / currency | Total return | CAGR | Max. drawdown | Period |
|---|---|---|---|---|
| VT ↗USD · U.S. dollar · Adjusted market price | +359.22% | +8.66% | −50.26% | 2008-06-26 — 2026-11-03Available history · 18.36 years |
View the peak and trough of each maximum drawdown
VT: 2008-06-26 → 2009-03-09, −50.26%. 4,618 daily observations.
MSCI World
U.S.-listed funds investing worldwideDeveloped-market equities; emerging markets are excluded.
| Product / currency | Total return | CAGR | Max. drawdown | Period |
|---|---|---|---|---|
| URTH ↗USD · U.S. dollar · Adjusted market price | +434.49% | +11.98% | −34.01% | 2012-01-12 — 2026-11-03Available history · 14.81 years |
View the peak and trough of each maximum drawdown
URTH: 2020-02-12 → 2020-03-23, −34.01%. 3,724 daily observations.
MSCI ACWI
U.S.-listed funds investing worldwideDeveloped and emerging-market equities.
| Product / currency | Total return | CAGR | Max. drawdown | Period |
|---|---|---|---|---|
| ACWI ↗USD · U.S. dollar · Adjusted market price | +339.83% | +8.29% | −56.28% | 2008-03-28 — 2026-11-03Available history · 18.60 years |
View the peak and trough of each maximum drawdown
ACWI: 2008-05-16 → 2009-03-09, −56.28%. 4,681 daily observations.
Global equities excluding the U.S.
U.S.-listed funds investing worldwideInternational equity exposure outside the United States.
| Product / currency | Total return | CAGR | Max. drawdown | Period |
|---|---|---|---|---|
| VXUS ↗USD · U.S. dollar · Adjusted market price | +164.51% | +6.36% | −35.97% | 2011-01-28 — 2026-11-03Available history · 15.77 years |
| IXUS ↗USD · U.S. dollar · Adjusted market price | +177.54% | +7.55% | −36.22% | 2012-10-24 — 2026-11-03Available history · 14.03 years |
View the peak and trough of each maximum drawdown
VXUS: 2018-01-26 → 2020-03-23, −35.97%. 3,965 daily observations.
IXUS: 2018-01-26 → 2020-03-23, −36.22%. 3,526 daily observations.
Developed markets excluding the U.S.
U.S.-listed funds investing worldwideDeveloped-market exposure; Canada coverage varies by benchmark.
| Product / currency | Total return | CAGR | Max. drawdown | Period |
|---|---|---|---|---|
| VEA ↗USD · U.S. dollar · Adjusted market price | +158.03% | +5.04% | −60.69% | 2007-07-26 — 2026-11-03Available history · 19.27 years |
| IEFA ↗USD · U.S. dollar · Adjusted market price | +201.84% | +8.19% | −34.79% | 2012-10-24 — 2026-11-03Available history · 14.03 years |
View the peak and trough of each maximum drawdown
VEA: 2007-10-31 → 2009-03-09, −60.69%. 4,850 daily observations.
IEFA: 2018-01-26 → 2020-03-23, −34.79%. 3,526 daily observations.
Emerging markets
U.S.-listed funds investing worldwideEmerging-market equities; providers differ in classifying countries such as South Korea.
| Product / currency | Total return | CAGR | Max. drawdown | Period |
|---|---|---|---|---|
| VWO ↗USD · U.S. dollar · Adjusted market price | +167.73% | +5.05% | −67.68% | 2006-11-03 — 2026-11-0320-year window · 20.00 years |
| IEMG ↗USD · U.S. dollar · Adjusted market price | +117.92% | +5.71% | −38.71% | 2012-10-24 — 2026-11-03Available history · 14.03 years |
| EEM ↗USD · U.S. dollar · Adjusted market price | +169.10% | +5.07% | −66.43% | 2006-11-03 — 2026-11-0320-year window · 20.00 years |
View the peak and trough of each maximum drawdown
VWO: 2007-10-31 → 2008-11-20, −67.68%. 5,030 daily observations.
IEMG: 2018-01-26 → 2020-03-23, −38.71%. 3,526 daily observations.
EEM: 2007-10-31 → 2008-11-20, −66.43%. 5,030 daily observations.
Europe
U.S.-listed funds investing worldwideEuropean equity exposure under different benchmark universes.
| Product / currency | Total return | CAGR | Max. drawdown | Period |
|---|---|---|---|---|
| VGK ↗USD · U.S. dollar · Adjusted market price | +182.96% | +5.34% | −63.61% | 2006-11-03 — 2026-11-0320-year window · 20.00 years |
| IEV ↗USD · U.S. dollar · Adjusted market price | +160.55% | +4.90% | −63.27% | 2006-11-03 — 2026-11-0320-year window · 20.00 years |
View the peak and trough of each maximum drawdown
VGK: 2007-10-31 → 2009-03-09, −63.61%. 5,030 daily observations.
IEV: 2007-10-31 → 2009-03-09, −63.27%. 5,030 daily observations.
Japan
U.S.-listed funds investing worldwideJapanese equities; currency-hedging policies differ across products.
| Product / currency | Total return | CAGR | Max. drawdown | Period |
|---|---|---|---|---|
| EWJ ↗USD · U.S. dollar · Adjusted market price | +138.07% | +4.43% | −53.55% | 2006-11-03 — 2026-11-0320-year window · 20.00 years |
| DXJ ↗USD · U.S. dollar · Adjusted market price | +494.18% | +9.32% | −49.63% | 2006-11-03 — 2026-11-0320-year window · 20.00 years |
View the peak and trough of each maximum drawdown
EWJ: 2007-02-26 → 2009-03-09, −53.55%. 5,030 daily observations.
DXJ: 2007-02-26 → 2009-03-09, −49.63%. 5,030 daily observations.
India
U.S.-listed funds investing worldwideEquity exposure to eligible Indian companies.
| Product / currency | Total return | CAGR | Max. drawdown | Period |
|---|---|---|---|---|
| INDA ↗USD · U.S. dollar · Adjusted market price | +109.93% | +5.16% | −45.07% | 2012-02-03 — 2026-11-03Available history · 14.75 years |
View the peak and trough of each maximum drawdown
INDA: 2018-01-23 → 2020-03-23, −45.07%. 3,709 daily observations.
Broad China
U.S.-listed funds investing worldwideChinese equity exposure across eligible share classes and listings.
| Product / currency | Total return | CAGR | Max. drawdown | Period |
|---|---|---|---|---|
| MCHI ↗USD · U.S. dollar · Adjusted market price | +29.86% | +1.69% | −62.84% | 2011-03-31 — 2026-11-03Available history · 15.60 years |
View the peak and trough of each maximum drawdown
MCHI: 2021-02-17 → 2022-10-31, −62.84%. 3,922 daily observations.
FTSE China 50
U.S.-listed funds investing worldwideLarge Chinese companies listed in Hong Kong; distinct from FTSE China A50.
| Product / currency | Total return | CAGR | Max. drawdown | Period |
|---|---|---|---|---|
| FXI ↗USD · U.S. dollar · Adjusted market price | +80.13% | +2.99% | −72.68% | 2006-11-03 — 2026-11-0320-year window · 20.00 years |
View the peak and trough of each maximum drawdown
FXI: 2007-10-31 → 2008-10-27, −72.68%. 5,030 daily observations.
CSI 300 A-shares
U.S.-listed funds investing worldwideU.S.-listed access to the mainland CSI 300 universe.
| Product / currency | Total return | CAGR | Max. drawdown | Period |
|---|---|---|---|---|
| ASHR ↗USD · U.S. dollar · Adjusted market price | +80.64% | +4.66% | −51.30% | 2013-11-06 — 2026-11-03Available history · 12.99 years |
View the peak and trough of each maximum drawdown
ASHR: 2021-02-17 → 2024-02-02, −51.30%. 3,267 daily observations.
CSI Overseas China Internet
U.S.-listed funds investing worldwideOverseas-listed Chinese internet companies.
| Product / currency | Total return | CAGR | Max. drawdown | Period |
|---|---|---|---|---|
| KWEB ↗USD · U.S. dollar · Adjusted market price | +13.94% | +0.99% | −80.92% | 2013-08-01 — 2026-11-03Available history · 13.26 years |
View the peak and trough of each maximum drawdown
KWEB: 2021-02-17 → 2022-10-24, −80.92%. 3,335 daily observations.
MSCI Hong Kong
U.S.-listed funds investing worldwideHong Kong equities under MSCI country-classification rules.
| Product / currency | Total return | CAGR | Max. drawdown | Period |
|---|---|---|---|---|
| EWH ↗USD · U.S. dollar · Adjusted market price | +189.34% | +5.46% | −63.58% | 2006-11-03 — 2026-11-0320-year window · 20.00 years |
View the peak and trough of each maximum drawdown
EWH: 2007-10-29 → 2008-11-20, −63.58%. 5,030 daily observations.
Country and regional funds
U.S.-listed funds investing worldwideSingle-country or regional exposures, each with its own market and currency risks.
| Product / currency | Total return | CAGR | Max. drawdown | Period |
|---|---|---|---|---|
| EWG ↗USD · U.S. dollar · Adjusted market price | +176.15% | +5.21% | −63.10% | 2006-11-03 — 2026-11-0320-year window · 20.00 years |
| EWJ ↗USD · U.S. dollar · Adjusted market price | +138.07% | +4.43% | −53.55% | 2006-11-03 — 2026-11-0320-year window · 20.00 years |
| EWT ↗USD · U.S. dollar · Adjusted market price | +715.65% | +11.06% | −62.91% | 2006-11-03 — 2026-11-0320-year window · 20.00 years |
View the peak and trough of each maximum drawdown
EWG: 2007-12-10 → 2009-03-09, −63.10%. 5,030 daily observations.
EWJ: 2007-02-26 → 2009-03-09, −53.55%. 5,030 daily observations.
EWT: 2007-10-29 → 2008-11-20, −62.91%. 5,030 daily observations.
Mainland Chinese government bonds
Mainland China bond categoriesSovereign bonds with maturity-dependent interest-rate exposure.
This is an index or strategy category without a single specified representative product. Consult the official fund directories for a specific fund.
Policy bank bonds
Mainland China bond categoriesDebt issued by Chinese policy banks.
This is an index or strategy category without a single specified representative product. Consult the official fund directories for a specific fund.
Local government bonds
Mainland China bond categoriesDebt issued by mainland local governments.
This is an index or strategy category without a single specified representative product. Consult the official fund directories for a specific fund.
Corporate and credit bonds
Mainland China bond categoriesCorporate borrowers with varying credit quality.
This is an index or strategy category without a single specified representative product. Consult the official fund directories for a specific fund.
Short-term financing and ultra-short debt
Mainland China bond categoriesShorter-maturity instruments with different issuers and credit risks.
This is an index or strategy category without a single specified representative product. Consult the official fund directories for a specific fund.
Convertible and exchangeable bonds
Mainland China bond categoriesBonds with equity-linked conversion or exchange features.
This is an index or strategy category without a single specified representative product. Consult the official fund directories for a specific fund.
Aggregate bonds
Mainland China bond categoriesBroad bond universes combining several issuer and maturity categories.
This is an index or strategy category without a single specified representative product. Consult the official fund directories for a specific fund.
Interbank negotiable certificates of deposit
Mainland China bond categoriesTradable bank certificates of deposit under the strategy's eligibility rules.
This is an index or strategy category without a single specified representative product. Consult the official fund directories for a specific fund.
0–3 month U.S. Treasuries
U.S.-listed bond fundsVery short-maturity U.S. Treasury exposure.
| Product / currency | Total return | CAGR | Max. drawdown | Period |
|---|---|---|---|---|
| SGOV ↗USD · U.S. dollar · Adjusted market price | +20.18% | +2.90% | −0.30% | 2020-06-01 — 2026-11-03Available history · 6.42 years |
View the peak and trough of each maximum drawdown
SGOV: 2026-10-30 → 2026-11-02, −0.30%. 1,616 daily observations.
1–3 month U.S. Treasury bills
U.S.-listed bond fundsShort Treasury bills; income changes as prevailing rates change.
| Product / currency | Total return | CAGR | Max. drawdown | Period |
|---|---|---|---|---|
| BIL ↗USD · U.S. dollar · Adjusted market price | +30.30% | +1.37% | −0.78% | 2007-05-30 — 2026-11-03Available history · 19.43 years |
View the peak and trough of each maximum drawdown
BIL: 2008-09-29 → 2015-12-09, −0.78%. 4,890 daily observations.
1–3 year U.S. Treasuries
U.S.-listed bond fundsShort-term U.S. government bonds.
| Product / currency | Total return | CAGR | Max. drawdown | Period |
|---|---|---|---|---|
| SHY ↗USD · U.S. dollar · Adjusted market price | +44.95% | +1.87% | −5.71% | 2006-11-03 — 2026-11-0320-year window · 20.00 years |
View the peak and trough of each maximum drawdown
SHY: 2021-08-02 → 2022-10-20, −5.71%. 5,030 daily observations.
7–10 year U.S. Treasuries
U.S.-listed bond fundsIntermediate-to-long Treasury exposure with meaningful rate sensitivity.
| Product / currency | Total return | CAGR | Max. drawdown | Period |
|---|---|---|---|---|
| IEF ↗USD · U.S. dollar · Adjusted market price | +84.30% | +3.10% | −23.92% | 2006-11-03 — 2026-11-0320-year window · 20.00 years |
View the peak and trough of each maximum drawdown
IEF: 2020-08-04 → 2023-10-19, −23.92%. 5,030 daily observations.
20+ year U.S. Treasuries
U.S.-listed bond fundsLong-duration Treasury exposure with substantial interest-rate sensitivity.
| Product / currency | Total return | CAGR | Max. drawdown | Period |
|---|---|---|---|---|
| TLT ↗USD · U.S. dollar · Adjusted market price | +71.03% | +2.72% | −48.35% | 2006-11-03 — 2026-11-0320-year window · 20.00 years |
View the peak and trough of each maximum drawdown
TLT: 2020-08-04 → 2023-10-19, −48.35%. 5,030 daily observations.
U.S. Treasury composite
U.S.-listed bond fundsTreasuries across several maturities.
| Product / currency | Total return | CAGR | Max. drawdown | Period |
|---|---|---|---|---|
| GOVT ↗USD · U.S. dollar · Adjusted market price | +17.57% | +1.11% | −19.07% | 2012-02-24 — 2026-11-03Available history · 14.69 years |
View the peak and trough of each maximum drawdown
GOVT: 2020-08-04 → 2023-10-19, −19.07%. 3,695 daily observations.
U.S. aggregate bonds
U.S.-listed bond fundsA broad investment-grade U.S. bond universe.
| Product / currency | Total return | CAGR | Max. drawdown | Period |
|---|---|---|---|---|
| AGG ↗USD · U.S. dollar · Adjusted market price | +77.91% | +2.92% | −18.43% | 2006-11-03 — 2026-11-0320-year window · 20.00 years |
| BND ↗USD · U.S. dollar · Adjusted market price | +74.52% | +2.89% | −18.58% | 2007-04-10 — 2026-11-03Available history · 19.57 years |
View the peak and trough of each maximum drawdown
AGG: 2020-08-04 → 2022-10-20, −18.43%. 5,030 daily observations.
BND: 2020-08-06 → 2022-10-20, −18.58%. 4,925 daily observations.
Investment-grade corporate bonds
U.S.-listed bond fundsCorporate debt meeting investment-grade criteria.
| Product / currency | Total return | CAGR | Max. drawdown | Period |
|---|---|---|---|---|
| LQD ↗USD · U.S. dollar · Adjusted market price | +113.93% | +3.88% | −24.95% | 2006-11-03 — 2026-11-0320-year window · 20.00 years |
View the peak and trough of each maximum drawdown
LQD: 2021-09-22 → 2022-10-20, −24.95%. 5,030 daily observations.
High-yield corporate bonds
U.S.-listed bond fundsBelow-investment-grade debt with greater credit risk.
| Product / currency | Total return | CAGR | Max. drawdown | Period |
|---|---|---|---|---|
| HYG ↗USD · U.S. dollar · Adjusted market price | +146.55% | +4.72% | −34.25% | 2007-04-11 — 2026-11-03Available history · 19.57 years |
| JNK ↗USD · U.S. dollar · Adjusted market price | +139.46% | +4.72% | −38.48% | 2007-12-04 — 2026-11-03Available history · 18.92 years |
View the peak and trough of each maximum drawdown
HYG: 2007-09-19 → 2008-11-20, −34.25%. 4,924 daily observations.
JNK: 2008-01-02 → 2009-03-09, −38.48%. 4,759 daily observations.
Inflation-protected Treasuries
U.S.-listed bond fundsInflation-linked principal with maturity-dependent real-rate exposure.
| Product / currency | Total return | CAGR | Max. drawdown | Period |
|---|---|---|---|---|
| TIP ↗USD · U.S. dollar · Adjusted market price | +91.80% | +3.31% | −14.51% | 2006-11-03 — 2026-11-0320-year window · 20.00 years |
| VTIP ↗USD · U.S. dollar · Adjusted market price | +33.03% | +2.05% | −6.27% | 2012-10-16 — 2026-11-03Available history · 14.05 years |
View the peak and trough of each maximum drawdown
TIP: 2021-11-09 → 2023-10-06, −14.51%. 5,030 daily observations.
VTIP: 2020-03-05 → 2020-03-18, −6.27%. 3,532 daily observations.
Floating-rate Treasuries and loans
U.S.-listed bond fundsDistinct exposures: government floating-rate notes and credit-sensitive bank loans.
| Product / currency | Total return | CAGR | Max. drawdown | Period |
|---|---|---|---|---|
| USFR ↗USD · U.S. dollar · Adjusted market price | +28.38% | +1.98% | −2.16% | 2014-02-04 — 2026-11-03Available history · 12.74 years |
| BKLN ↗USD · U.S. dollar · Adjusted market price | +78.88% | +3.78% | −24.17% | 2011-03-03 — 2026-11-03Available history · 15.67 years |
View the peak and trough of each maximum drawdown
USFR: 2014-02-04 → 2014-12-22, −2.16%. 3,207 daily observations.
BKLN: 2020-01-08 → 2020-03-23, −24.17%. 3,942 daily observations.
Municipal bonds
U.S.-listed bond fundsDebt of eligible U.S. municipal issuers.
| Product / currency | Total return | CAGR | Max. drawdown | Period |
|---|---|---|---|---|
| MUB ↗USD · U.S. dollar · Adjusted market price | +73.70% | +2.93% | −13.68% | 2007-09-10 — 2026-11-03Available history · 19.15 years |
View the peak and trough of each maximum drawdown
MUB: 2020-03-09 → 2020-03-19, −13.68%. 4,819 daily observations.
Emerging-market bonds
U.S.-listed bond fundsEmerging-market debt with sovereign, credit and currency considerations.
| Product / currency | Total return | CAGR | Max. drawdown | Period |
|---|---|---|---|---|
| EMB ↗USD · U.S. dollar · Adjusted market price | +124.48% | +4.38% | −34.70% | 2007-12-19 — 2026-11-03Available history · 18.88 years |
View the peak and trough of each maximum drawdown
EMB: 2008-05-21 → 2008-10-28, −34.70%. 4,748 daily observations.
International bonds
U.S.-listed bond fundsBonds outside the U.S.; currency hedging depends on the product.
| Product / currency | Total return | CAGR | Max. drawdown | Period |
|---|---|---|---|---|
| BNDX ↗USD · U.S. dollar · Adjusted market price | +34.09% | +2.21% | −16.23% | 2013-06-04 — 2026-11-03Available history · 13.42 years |
View the peak and trough of each maximum drawdown
BNDX: 2020-12-11 → 2022-10-20, −16.23%. 3,376 daily observations.
Gold: spot and physically backed products
Commodities, currencies and freightGold exposure through the product's specific holding and trust structure.
| Product / currency | Total return | CAGR | Max. drawdown | Period |
|---|---|---|---|---|
| 518880 ↗CNY · Renminbi · NAV, reinvested | +201.44% | +8.65% | −33.07% | 2013-07-18 — 2026-11-03Available history · 13.29 years |
| GLD ↗USD · U.S. dollar · Adjusted market price | +476.66% | +9.16% | −45.56% | 2006-11-03 — 2026-11-0320-year window · 20.00 years |
| IAU ↗USD · U.S. dollar · Adjusted market price | +490.40% | +9.28% | −45.14% | 2006-11-03 — 2026-11-0320-year window · 20.00 years |
| 2840.HK ↗ | Pending verification · This series failed coverage or anomaly checks. Return figures are withheld. | |||
View the peak and trough of each maximum drawdown
518880: 2026-01-29 → 2026-11-02, −33.07%. 3,237 daily observations.
GLD: 2011-08-22 → 2015-12-17, −45.56%. 5,030 daily observations.
IAU: 2011-08-22 → 2015-12-02, −45.14%. 5,030 daily observations.
2840.HK: Data pending verification.
Silver
Commodities, currencies and freightSilver exposure through the product's holding structure.
| Product / currency | Total return | CAGR | Max. drawdown | Period |
|---|---|---|---|---|
| SLV ↗USD · U.S. dollar · Adjusted market price | +257.23% | +6.57% | −76.28% | 2006-11-03 — 2026-11-0320-year window · 20.00 years |
View the peak and trough of each maximum drawdown
SLV: 2011-04-28 → 2020-03-18, −76.28%. 5,030 daily observations.
Platinum and palladium
Commodities, currencies and freightSeparate precious-metal exposures.
| Product / currency | Total return | CAGR | Max. drawdown | Period |
|---|---|---|---|---|
| PPLT ↗USD · U.S. dollar · Adjusted market price | −19.37% | −1.27% | −70.73% | 2010-01-08 — 2026-11-03Available history · 16.82 years |
| PALL ↗USD · U.S. dollar · Adjusted market price | +96.20% | +4.09% | −73.63% | 2010-01-08 — 2026-11-03Available history · 16.82 years |
View the peak and trough of each maximum drawdown
PPLT: 2011-08-22 → 2020-03-19, −70.73%. 4,231 daily observations.
PALL: 2022-03-08 → 2024-08-05, −73.63%. 4,231 daily observations.
U.S. dollar index and individual currencies
Commodities, currencies and freightCurrency strategies with different benchmarks and implementation structures.
| Product / currency | Total return | CAGR | Max. drawdown | Period |
|---|---|---|---|---|
| UUP ↗USD · U.S. dollar · Adjusted market price | +41.17% | +1.77% | −22.19% | 2007-03-01 — 2026-11-03Available history · 19.68 years |
| FXE ↗USD · U.S. dollar · Adjusted market price | −7.87% | −0.41% | −43.33% | 2006-11-03 — 2026-11-0320-year window · 20.00 years |
View the peak and trough of each maximum drawdown
UUP: 2008-11-20 → 2011-07-26, −22.19%. 4,952 daily observations.
FXE: 2008-07-11 → 2022-09-27, −43.33%. 5,030 daily observations.
Gold miners
Commodities, currencies and freightMining-company equities, which behave differently from physical gold.
| Product / currency | Total return | CAGR | Max. drawdown | Period |
|---|---|---|---|---|
| GDX ↗USD · U.S. dollar · Adjusted market price | +135.67% | +4.38% | −80.57% | 2006-11-03 — 2026-11-0320-year window · 20.00 years |
| GDXJ ↗USD · U.S. dollar · Adjusted market price | +32.31% | +1.66% | −88.66% | 2009-11-11 — 2026-11-03Available history · 16.98 years |
View the peak and trough of each maximum drawdown
GDX: 2011-09-08 → 2016-01-19, −80.57%. 5,030 daily observations.
GDXJ: 2011-04-08 → 2016-01-19, −88.66%. 4,270 daily observations.
Crude oil futures
Commodities, currencies and freightFutures-based oil exposure, affected by contract selection and roll costs.
| Product / currency | Total return | CAGR | Max. drawdown | Period |
|---|---|---|---|---|
| USO ↗USD · U.S. dollar · Adjusted market price | −62.47% | −4.78% | −98.19% | 2006-11-03 — 2026-11-0320-year window · 20.00 years |
View the peak and trough of each maximum drawdown
USO: 2008-07-14 → 2020-04-28, −98.19%. 5,030 daily observations.
Natural gas futures
Commodities, currencies and freightNatural gas futures exposure with potentially substantial volatility and roll effects.
| Product / currency | Total return | CAGR | Max. drawdown | Period |
|---|---|---|---|---|
| UNG ↗USD · U.S. dollar · Adjusted market price | −99.86% | −28.54% | −99.89% | 2007-04-18 — 2026-11-03Available history · 19.55 years |
View the peak and trough of each maximum drawdown
UNG: 2008-07-01 → 2026-11-02, −99.89%. 4,919 daily observations.
Broad commodity futures
Commodities, currencies and freightMulti-commodity strategies; indices and management approaches differ.
| Product / currency | Total return | CAGR | Max. drawdown | Period |
|---|---|---|---|---|
| DBC ↗USD · U.S. dollar · Adjusted market price | +66.21% | +2.57% | −76.36% | 2006-11-03 — 2026-11-0320-year window · 20.00 years |
| PDBC ↗USD · U.S. dollar · Adjusted market price | +71.76% | +4.62% | −49.52% | 2014-11-07 — 2026-11-03Available history · 11.99 years |
View the peak and trough of each maximum drawdown
DBC: 2008-07-02 → 2020-04-27, −76.36%. 5,030 daily observations.
PDBC: 2014-11-07 → 2020-04-28, −49.52%. 3,014 daily observations.
Agricultural and grain futures
Commodities, currencies and freightAgricultural futures baskets or single-crop exposures.
| Product / currency | Total return | CAGR | Max. drawdown | Period |
|---|---|---|---|---|
| DBA ↗USD · U.S. dollar · Adjusted market price | +27.45% | +1.23% | −67.97% | 2007-01-05 — 2026-11-03Available history · 19.83 years |
| CORN ↗USD · U.S. dollar · Adjusted market price | −31.65% | −2.29% | −78.09% | 2010-06-09 — 2026-11-03Available history · 16.40 years |
| WEAT ↗USD · U.S. dollar · Adjusted market price | −82.15% | −10.77% | −84.32% | 2011-09-19 — 2026-11-03Available history · 15.12 years |
| SOYB ↗USD · U.S. dollar · Adjusted market price | +4.89% | +0.32% | −53.76% | 2011-09-19 — 2026-11-03Available history · 15.12 years |
View the peak and trough of each maximum drawdown
DBA: 2008-02-26 → 2020-06-26, −67.97%. 4,989 daily observations.
CORN: 2012-08-21 → 2020-08-04, −78.09%. 4,127 daily observations.
WEAT: 2012-09-14 → 2025-12-17, −84.32%. 3,804 daily observations.
SOYB: 2012-09-04 → 2020-04-28, −53.76%. 3,804 daily observations.
Industrial metals and copper
Commodities, currencies and freightCPER uses copper futures; COPX holds copper-mining equities.
| Product / currency | Total return | CAGR | Max. drawdown | Period |
|---|---|---|---|---|
| CPER ↗USD · U.S. dollar · Adjusted market price | +52.94% | +2.88% | −57.83% | 2011-11-15 — 2026-11-03Available history · 14.97 years |
| COPX ↗USD · U.S. dollar · Adjusted market price | +129.80% | +5.16% | −83.16% | 2010-04-20 — 2026-11-03Available history · 16.54 years |
View the peak and trough of each maximum drawdown
CPER: 2012-02-09 → 2015-02-02, −57.83%. 3,763 daily observations.
COPX: 2011-04-06 → 2016-01-20, −83.16%. 4,162 daily observations.
Freight futures
Commodities, currencies and freightBWET focuses on tanker freight; BDRY on dry-bulk freight futures.
| Product / currency | Total return | CAGR | Max. drawdown | Period |
|---|---|---|---|---|
| BWET ↗USD · U.S. dollar · Adjusted market price | +5894.26% | +221.57% | −56.90% | 2023-05-03 — 2026-11-03Available history · 3.50 years |
| BDRY ↗USD · U.S. dollar · Adjusted market price | −51.39% | −8.03% | −89.16% | 2018-03-22 — 2026-11-03Available history · 8.62 years |
View the peak and trough of each maximum drawdown
BWET: 2023-06-15 → 2025-01-06, −56.90%. 880 daily observations.
BDRY: 2021-10-06 → 2023-07-19, −89.16%. 2,167 daily observations.
Covered-call strategies
Specialized exchange-traded strategiesCombines equity exposure with call writing, exchanging some upside for option premiums.
| Product / currency | Total return | CAGR | Max. drawdown | Period |
|---|---|---|---|---|
| QYLD ↗USD · U.S. dollar · Adjusted market price | +180.70% | +8.33% | −24.75% | 2013-12-12 — 2026-11-03Available history · 12.89 years |
| XYLD ↗USD · U.S. dollar · Adjusted market price | +191.18% | +8.33% | −33.46% | 2013-06-24 — 2026-11-03Available history · 13.36 years |
View the peak and trough of each maximum drawdown
QYLD: 2020-02-19 → 2020-03-16, −24.75%. 3,242 daily observations.
XYLD: 2020-02-19 → 2020-03-23, −33.46%. 3,362 daily observations.
Active option-income strategies
Specialized exchange-traded strategiesActively managed equity and option-linked income strategies.
| Product / currency | Total return | CAGR | Max. drawdown | Period |
|---|---|---|---|---|
| JEPI ↗USD · U.S. dollar · Adjusted market price | +96.48% | +11.03% | −13.71% | 2020-05-21 — 2026-11-03Available history · 6.45 years |
| JEPQ ↗USD · U.S. dollar · Adjusted market price | +80.06% | +13.96% | −20.07% | 2022-05-04 — 2026-11-03Available history · 4.50 years |
View the peak and trough of each maximum drawdown
JEPI: 2022-04-20 → 2022-09-30, −13.71%. 1,622 daily observations.
JEPQ: 2025-02-19 → 2025-04-08, −20.07%. 1,130 daily observations.
Managed futures and trend following
Specialized exchange-traded strategiesFutures-based strategies responding to trends across asset classes.
| Product / currency | Total return | CAGR | Max. drawdown | Period |
|---|---|---|---|---|
| KMLM ↗USD · U.S. dollar · Adjusted market price | +46.39% | +6.65% | −31.01% | 2020-12-02 — 2026-11-03Available history · 5.92 years |
| DBMF ↗USD · U.S. dollar · Adjusted market price | +97.65% | +9.52% | −20.39% | 2019-05-08 — 2026-11-03Available history · 7.49 years |
View the peak and trough of each maximum drawdown
KMLM: 2022-10-14 → 2025-06-20, −31.01%. 1,487 daily observations.
DBMF: 2022-10-20 → 2023-03-24, −20.39%. 1,884 daily observations.
Multi-asset and risk parity
Specialized exchange-traded strategiesCombines assets using allocation or risk-balancing rules.
This is an index or strategy category without a single specified representative product. Consult the official fund directories for a specific fund.
Buffer and defined-outcome strategies
Specialized exchange-traded strategiesOptions shape gains and losses over a specified outcome period; terms matter.
This is an index or strategy category without a single specified representative product. Consult the official fund directories for a specific fund.
Leveraged and inverse products
Specialized exchange-traded strategiesTargets daily multiples or inverse returns; long-run results depend on the path.
| Product / currency | Total return | CAGR | Max. drawdown | Period |
|---|---|---|---|---|
| TQQQ ↗USD · U.S. dollar · Adjusted market price | +29409.93% | +40.50% | −81.66% | 2010-02-11 — 2026-11-03Available history · 16.73 years |
| SQQQ ↗USD · U.S. dollar · Adjusted market price | ≈−100% | −52.03% | ≈−100% | 2010-02-11 — 2026-11-03Available history · 16.73 years |
| SPXL ↗USD · U.S. dollar · Adjusted market price | +8122.34% | +27.77% | −76.86% | 2008-11-05 — 2026-11-03Available history · 17.99 years |
View the peak and trough of each maximum drawdown
TQQQ: 2021-11-19 → 2022-12-28, −81.66%. 4,208 daily observations.
SQQQ: 2010-02-11 → 2026-10-06, ≈−100%. 4,208 daily observations.
SPXL: 2020-02-19 → 2020-03-23, −76.86%. 4,526 daily observations.
Volatility futures
Specialized exchange-traded strategiesVIX futures exposure; VIXY and the VXX ETN have different legal structures.
| Product / currency | Total return | CAGR | Max. drawdown | Period |
|---|---|---|---|---|
| VIXY ↗USD · U.S. dollar · Adjusted market price | ≈−100% | −48.36% | ≈−100% | 2011-01-04 — 2026-11-03Available history · 15.83 years |
| VXX ↗USD · U.S. dollar · Adjusted market price | −98.93% | −40.41% | −99.62% | 2018-01-25 — 2026-11-03Available history · 8.77 years |
View the peak and trough of each maximum drawdown
VIXY: 2011-10-03 → 2026-10-13, ≈−100%. 3,982 daily observations.
VXX: 2020-03-18 → 2026-10-13, −99.62%. 2,206 daily observations.
Bitcoin and Ether
Specialized exchange-traded strategiesCryptoasset exposure through the product's specific structure.
| Product / currency | Total return | CAGR | Max. drawdown | Period |
|---|---|---|---|---|
| IBIT ↗USD · U.S. dollar · Adjusted market price | +65.41% | +19.60% | −53.30% | 2024-01-11 — 2026-11-03Available history · 2.81 years |
| ETHA ↗USD · U.S. dollar · Adjusted market price | −34.22% | −16.78% | −67.91% | 2024-07-23 — 2026-11-03Available history · 2.28 years |
View the peak and trough of each maximum drawdown
IBIT: 2025-10-06 → 2026-06-30, −53.30%. 706 daily observations.
ETHA: 2025-08-22 → 2026-06-25, −67.91%. 574 daily observations.
Single-stock ETFs
Specialized exchange-traded strategiesConcentrated exposure to one company, sometimes with leverage or options.
This is an index or strategy category without a single specified representative product. Consult the official fund directories for a specific fund.
Active thematic ETFs
Specialized exchange-traded strategiesActively selected thematic equities; ARKK is not an index-tracking fund.
| Product / currency | Total return | CAGR | Max. drawdown | Period |
|---|---|---|---|---|
| ARKK ↗USD · U.S. dollar · Adjusted market price | +336.72% | +13.06% | −80.91% | 2014-10-31 — 2026-11-03Available history · 12.01 years |
View the peak and trough of each maximum drawdown
ARKK: 2021-02-12 → 2022-12-28, −80.91%. 3,019 daily observations.
Build your own judgment
From “What went up most?”
to “What do I actually own?”
A useful comparison begins with the assets you want to hold, then the vehicle used to hold them. History helps build intuition. The fund’s rules tell you how its basket can change.
Define the role
Is this money for long-term growth, diversification or short-term cash management? Equities, long bonds and short bonds serve different purposes.
Open the methodology and holdings
Check geography, industries, company size, selection and weighting. Compare top-ten holdings across funds to spot overlapping bets.
Put return and risk in the same period
Consider total return, CAGR, drawdown depth and duration together. Repeat the comparison from different starting dates rather than relying on one attractive stretch.
Inspect the vehicle
Compare fees, tracking differences, size, liquidity, bid–ask spreads, premiums or discounts, structure and currency. The expense ratio is not the only cost.
Choose a holding plan you can sustain
Reserve the cash you need before deciding contribution timing and rebalancing rules. A plan needs room for market volatility and for life.
You do not need every ticker.
First, know what is in the basket.
Then decide how much of your world
it should hold.
Five questions for the classroom
- Does buying SPY and VOO double diversification?
No. Both track the S&P 500 and their principal holdings overlap heavily.
- Are the CSI 500 and CSI A500 the same index?
No. Their selection universes, industry coverage and rules differ.
- Do U.S.-listed ETFs invest only in the U.S.?
No. They can hold assets in China, Europe or worldwide.
- Does a 10% distribution mean a 10% profit?
No. Include the change in fund value as well as cash distributions.
- Does a historical 20% maximum drawdown cap future losses at 20%?
No. Historical maximum drawdown is not a risk limit.
Make the numbers traceable
Data and methodology
This article reorganizes and expands the supplied teaching handout on Chinese and U.S. ETF indices. Historical metrics are calculated by this site from public market data. They are not issuers’ official performance tables or trading recommendations. Past performance does not predict future results.
- Observation period
- The common cutoff is November 3, 2026; the target starting date is November 3, 2006. Products with shorter histories begin at their first valid NAV or trading observation. Each row shows its actual period. The first available record may differ from inception or listing, so incomplete coverage is labeled “Available history.” We do not splice pre-launch index backtests into fund histories. Tracker Fund of Hong Kong, 2800.HK, listed in 1999, but this source begins in 2008. That coverage gap remains explicit: it is neither a complete 20-year nor a since-inception record.
- Prices and returns
- Mainland products use unit NAV, cash distributions per unit and share-conversion records disclosed by Eastmoney. Returns compound each period as (current NAV × share-conversion ratio + distribution per unit) / previous NAV. A few early observations during portfolio establishment may be weekly. Other products use Yahoo Finance daily adjusted close, incorporating distributions and splits under the vendor’s methodology as an approximation to market-price total return. NAV return and market-price return differ and are labeled separately. Actual returns also depend on execution timing, commissions, spreads, personal taxes and reinvestment conditions. Fund operating expenses are already reflected in performance and are not deducted twice.
- Calculations
- Total return = ending value / starting value − 1. CAGR = (ending value / starting value)365.2425 / actual calendar days − 1. Maximum drawdown = mint(reinvested wealth at date t / highest reinvested wealth through t − 1). Histories shorter than one year are not annualized.
- Currencies and comparability
- CNY, HKD and USD are labeled separately. Results are not currency-hedged, converted to renminbi or adjusted for inflation. Renminbi return is approximately (1 + foreign-currency asset return) × (1 + change in that currency versus renminbi) − 1. Different start dates, crisis coverage and product rules prevent a direct ranking of investment ability.
- Coverage limits
- Figures are displayed only for series passing daily-frequency, endpoint-coverage, positive-value and abnormal-jump checks. Missing results are “Pending verification,” never zero or a substitute fund’s return. Drawdowns based on daily closes or NAV cannot capture intraday extremes. Vendors may revise historical distributions or splits. Confirm name changes, benchmark changes and current fund status in the issuer’s latest documents.
- Share-conversion corrections
- Some historical share conversions for 159922, 159943 and 512100 were missing or assigned to the wrong date. They were corrected using the Harvest annual report, Dacheng fund report and Southern fund annual report, respectively. The 2840.HK series mixes prices in different currencies and remains pending verification.
- Sources you can inspect
- Every product ticker links to its historical NAV or price source. Official definitions and product rules are linked below. Of 236 products, 235 passed calculation checks and 1 is pending verification.
- SSE ETF learning center · HKEX exchange-traded products: structures, classifications and trading mechanisms.
- China Securities Index · CNI Index: A-share methodologies and product lookups; CSI A500 methodology (Chinese).
- Tracker Fund history · Hang Seng product licensing directory · Hang Seng TECH: universes, rules and related products.
- S&P 500 · FTSE Russell U.S. indices.
- Nasdaq-100 · Invesco QQQ: the large non-financial company universe.
- ProShares TQQQ · Global X QYLD · USCF USO: daily leverage, covered calls and oil futures.
- Schwab SCHD · iShares SGOV · iShares TLT: dividend strategies and different bond durations.
- SSE fund directory · SZSE ETF directory · HKEX ETP directory · Nasdaq ETF screener: find products beyond this guide.